
Fig. 3
- ID
- ZDB-FIG-140822-9
- Publication
- Whitesell et al., 2014 - An alpha-smooth muscle actin (acta2/alphasma) zebrafish transgenic line marking vascular mural cells and visceral smooth muscle cells
- Other Figures
- All Figure Page
- Back to All Figure Page
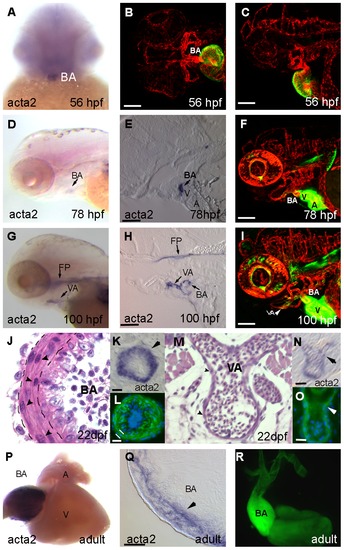
Smooth muscle markers are restricted to the developing cardiac outflow tract by 56 hpf. (A) At 56 hpf, acta2 expression is restricted to the developing BA. (B,C) Double transgenic Tg(acta2:EGFP)ca7; Tg(kdrl:mCherry)ci5 embryo shows expression of EGFP in both the atrium and ventricle of the heart at 56 hpf, but not in the BA. (D) acta2 expression is evident at 78 hpf in the BA in both wholemount and cross section (E) and in transgenic animals (F). (G–I) Expression of acta2 continues to be restricted to the BA and ventral aorta (VA) at 100 hpf by in situ hybridization and in transgenic fish. (J–O): Cross sections of the 22 dpf BA show a multilamellar arterial phenotype as visualized by hematoxylin and eosin staining (J), in situ hybridization of acta2 (K) and transgenic GFP (nuclei stained blue with DAPI, L). The bulbus vascular wall consists of three layers: an inner intima, middle media, and outer adventitia (Ad, separated by black lines in J). The intima is endothelial (arrowheads point to nuclei of endothelial cells). The media consists of 3–4 cell-thick layers of vascular smooth muscle cells (M, arrows point to nuclei of SMCs). In comparison to the BA, the vascular wall of the VA at 22 dpf is thin (M) but expresses acta2 by in situ hybridization (N) and GFP in transgenic animals (O). The endothelium of VA is covered by a thin layer of SMCs (arrowheads point to nuclei of SMCs). (P) In situ hybridization of the wholemount adult heart shows strong staining in the bulbus arteriosus, but not ventricle or atrium, which is localized to the myocardial wall in cross section (Q). (R) Wholemount dissected acta2:EGFP transgenic heart shows stronger expression of GFP in the bulbus arteriosus as compared to ventricle. Staining is also continuous with the ventral aorta. In B,C, F, I, and R, green expression is acta2:EGFP transgene. Scale bar in B, C, F, and I is 100 μm. Scale bar in E, H, and Q is 50 μm. Scale bar in K, L, N, and O is 20 μm. |