
Fig. 1
- ID
- ZDB-FIG-140715-66
- Publication
- Sampaio et al., 2014 - Left-Right Organizer Flow Dynamics: How Much Cilia Activity Reliably Yields Laterality?
- Other Figures
- All Figure Page
- Back to All Figure Page
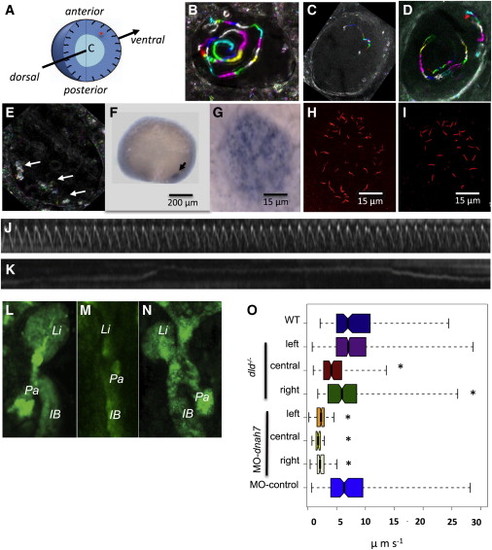
Genetically Generating a Range of Fluid Flow Speeds (A) Cartoon representing a Kupffer’s vesicle in 3D; light blue denotes central region, dark blue illustrates the peripheral region, and the arrow shows how we scanned the KV for native particles (represented in red) according to the dorsal-ventral axis. (B–E) Representative KV flow map (B) for a WT embryo, (C and D) for two different dld-/- mutant embryos, and (E) for a MO-dnah7-injected embryo displaying what seems to be Brownian motion (arrows). Left is to the left and anterior to the top throughout. (F) Zebrafish embryo with 14 hpf showing expression of dnah7 mRNA in the KV. (G) Expression of dnah7 mRNA in the KV amplified region. (H and I) Immunofluorescence with anti-acetylated α-tubulin to visualize the presence of KV cilia in a dnah7-MO-injected embryo that showed (H) complete absence of cilia motility during high-speed videomicroscopy and (I) a WT control embryo. (J) Kymograph showing an example of one motile cilium from a dnah7 knockdown embryo showing a consistent beat frequency over 2 s filmed with 500 fps. (K) Kymograph of a cilium from a dnah7 knockdown embryo that shows no active motility over 2 s at 500 fps. (L–N) Gut laterality at 50 hpf filmed from the ventral side after dissecting the yolk. z projection showing the liver, pancreas, and intestinal bulb of a (L) WT embryo tg(sox17:GFP)s870, (M) dld-/- mutant in the same genetic background and developmental stage showing a gut without lateralization, and (N) another dld-/- mutant showing reversed organ position. Li, liver; Pa, pancreas; IB, intestinal bulb. (O) Box plot of flow speed in WT, dld-/- embryos, and MO-dnah7-injected embryos (p < 0.05, Wilcoxon test). Left, central, and right conditions refer to liver situs. The total number of tracks (nt) and embryos (ne) followed with native particles for each condition was as follows: for WT: nt = 847, ne = 7; for dld-/- mutants with left liver: nt = 7,877, ne = 21; for dld-/- mutants with centralized guts: nt = 1,458, ne = 2; for dld-/- mutants with right liver: nt = 858, ne = 3; for dnah7 knockdown embryos with left liver: nt = 1,105, ne = 3; for dnah7 knockdown embryos with central liver: nt = 505, ne = 1; for dnah7 knockdown embryos with right liver: nt = 1,860, ne = 4; and for dnah7 mismatch control-MO: nt = 1,700, ne = 5. Notched box plots display a “notch” or narrowing of the box around the median. Box plot whiskers represent the minimum and maximum of all of the data. |
| Genes: | |
|---|---|
| Fish: | |
| Anatomical Terms: | |
| Stage Range: | 10-13 somites to Long-pec |
| Fish: | |
|---|---|
| Knockdown Reagent: | |
| Observed In: | |
| Stage Range: | 10-13 somites to Long-pec |
Reprinted from Developmental Cell, 29(6), Sampaio, P., Ferreira, R.R., Guerrero, A., Pintado, P., Tavares, B., Amaro, J., Smith, A.A., Montenegro-Johnson, T., Smith, D.J., Lopes, S.S., Left-Right Organizer Flow Dynamics: How Much Cilia Activity Reliably Yields Laterality?, 716-28, Copyright (2014) with permission from Elsevier. Full text @ Dev. Cell