
Fig. S3
- ID
- ZDB-FIG-140716-21
- Publication
- Sampaio et al., 2014 - Left-Right Organizer Flow Dynamics: How Much Cilia Activity Reliably Yields Laterality?
- Other Figures
- All Figure Page
- Back to All Figure Page
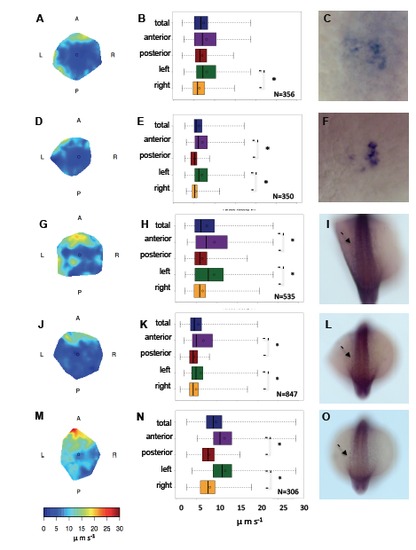
Correlation between normal fluid flow and early left-right markers, Related to Figure 6. (A-F) Wild-type embryos with flows higher than 5 μms-1 with stronger left sided flow reported by flow heat map (A, D) and by the quantification of flow in each KV half (B, E) showing an asymmetric charon expression on the right side of the KV (C, F). (G-O) Wild-type embryos with strong left sided anterior flow reported by flow heat map (G, J, M) and by the quantification of flow in each KV half (H, K, N) showing an asymmetric spaw expression on the left side of the LPM (I, L, O). KV Kupffer’s vesicle; LPM lateral plate mesoderm; N number of particle tracks measured in each embryo. Arrows indicate spaw expression; boxplot whiskers represent the minimum and maximum of all of the data. |
Reprinted from Developmental Cell, 29(6), Sampaio, P., Ferreira, R.R., Guerrero, A., Pintado, P., Tavares, B., Amaro, J., Smith, A.A., Montenegro-Johnson, T., Smith, D.J., Lopes, S.S., Left-Right Organizer Flow Dynamics: How Much Cilia Activity Reliably Yields Laterality?, 716-28, Copyright (2014) with permission from Elsevier. Full text @ Dev. Cell