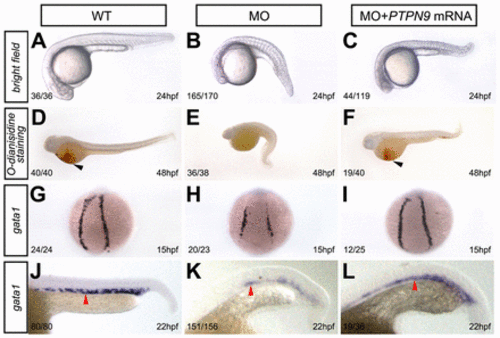
Knockdown of ptpn9a depletes embryos of primitive erythrocytes. (A–C) Brightfield images of control (A), a ptpn9a morphant (MO) (B) and a ptpn9a morphant that had been co-injected with human PTPN9 mRNA (C) at 24 hpf. (D–F) o-Dianisidine staining showed depletion of erythroid cells in ptpn9a-morphant embryos (E), compared with controls (D). Human PTPN9 mRNA partially rescued primitive erythropoiesis in ptpn9a-morphant embryos (F). In D and F, black arrowheads indicate erythrocytes. (G–L) RNA in situ hybridization was performed with gata1 probes in controls at 15 hpf (G) and 22 hpf (J), ptpn9a morphants at 15 hpf (H) and 22 hpf (K), and ptpn9a morphants that had been co-injected with human PTPN9 mRNA at 15 hpf (I) and 22 hpf (L). Note reduced gata1 expression in the PLPM (H) and ICM (K), which were partially rescued by co-injection of human PTPN9 mRNA (I,L). Red arrowheads indicate the ICM (J–L). Lateral views are shown with anterior to the left (A–C, D–F, J–L); dorsal views are shown with anterior to the top (G–I). The number of phenotypic embryos/total embryos is shown in the bottom left-hand corner.
|

