
Fig. S2
- ID
- ZDB-FIG-140710-50
- Publication
- Bu et al., 2014 - Protein tyrosine phosphatase PTPN9 regulates erythroid cell development through STAT3 dephosphorylation in zebrafish
- Other Figures
- All Figure Page
- Back to All Figure Page
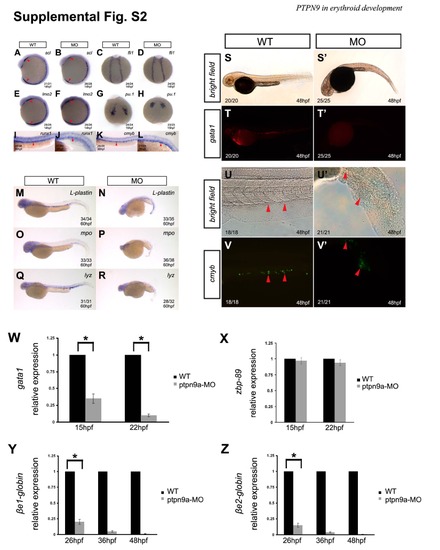
ptpn9a knockdown depletes erythrocytes and has mild effects on myeloid cells but not hematopoietic stem cells. (A-F) The hematopoietic progenitor markers scl/tal1, lmo2, and fli1 were not affected in ptpn9a morphants (B, D, F), compared with controls (A, C, E) at 14 hpf. Red arrowheads indicate the ALPM and the PLPM. (G-H) The myeloid progenitor marker pu.1 was not altered in ptpn9a morphants (H), compared with controls (G) at 15 hpf. (I-L) The hematopoietic stem cell markers runx1 and cmyb were not altered in ptpn9a morphants (J, L), compared with controls (I, K) at 36 hpf. (M-R) The myeloid genes l-plastin, myeloperoxidase (mpo) and lysozyme C (lyz) were slightly reduced in ptpn9a morphants (N, P, R), compared with controls (M, O, Q) at 60 hpf. (S-T′) Ptpn9a-MOs were injected into Tg(gata1-deRed) transgenic embryos, in which erythrocytes were labeled by DsRed. Note the erythrocytes were abolished in ptpn9a morphants at 48 hpf (T′), compared with controls (T), Bright-field images of wild-type (S) and morphant (S′) as shown in panels. (U-V′) Ptpn9a-MOs were injected into Tg(cmyb-EGFP) transgenic embryos, in which HSCs were labeled by EGFP. Note comparable numbers of EGFP-positive HSCs in the caudal hematopoietic tissue between ptpn9a morphant (V′) and wild-type (V) embryos at 48 hpf. Bright-field images of control (U) and morphant (U′). Lateral views are shown with anterior to the left (A-B; E-F; I-V′); dorsal views are shown with anterior to the top (C-D; G-H). (W-Z) Differentiated erythroid genes gata1, βe1-globin and βe2-globin reduced in ptpn9a morphants, compared with controls (W, Y and Z), but hematopoietic progenitor gene zbp-89 was normally expressed in both ptpn9a morphants and wild-type embryos (X). Erythroid gene expression was normalized by GAPDH. Measurements are the means from 3 independent experiments ± SD. *P <0.05. |