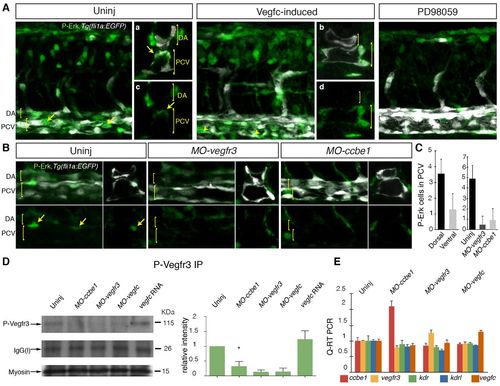
Vegfr3-dependent Erk signaling requires ccbe1 during the induction of secondary sprouting in zebrafish. (A) Analysis of phospho-Erk (P-Erk) expression in 32 hpf embryos. P-Erk (green) and fli1a:EGFP (white) images (lateral view) show P-Erk detected broadly in whole-mount and cross-sectioned (right-hand panels, merge upper, P-Erk lower) control embryos. Signal was increased in Vegfc-induced (dll4 MO + vegfc mRNA-injected) embryos in the posterior cardinal vein (n=8/8; Vegfc-induced embryos all showed ectopic expression in the ventral wall of the PCV). Cross section merged channel images shown in a and b, P-Erk only in c and d. Treatment with the Erk inhibitor PD98059 led to a reduction in all P-Erk staining. Arrows indicate P-Erk expression in the dorsal PCV. DA (dorsal aorta) and PCV (posterior cardinal vein) are indicated. (B) Comparison of P-Erk staining in control uninjected (left), MO-vegfr3 and MO-ccbe1 embryos. Upper panels are merged images and lower P-Erk only, viewed laterally (left) and cross-sectioned (right). Cross sections (right) are from separate embryos. Arrows indicate P-Erk expression in the dorsal PCV. DA and PCV are indicated. (C) Quantification of P-Erk-positive cells in the cardinal vein located in the dorsal compared with ventral wall (left-hand graph). Scores through individual sections of z-stack images from 12 control embryos, scored laterally across three somites in the trunk. Quantification of P-Erk-positive cells in the cardinal vein in control and MO-injected conditions (right-hand graph) (scores from n=10 control embryos, n=13 MO-vegfr3-injected and n=15 MO-ccbe1-injected embryos). (D) Immunoprecipitation (IP) and western blot (IB) detection of phosphorylated Vegfr3 at 32 hpf in wild type and in ccbe1, vegfr3, vegfc morphant and vegfc mRNA-injected embryos. The level of phosphorylated Vegfr3 is markedly reduced in ccbe1, vegfr3 and vegfc morphants, but is increased in vegfc-mRNA injected (500 ng) embryos compared with wild type (D, upper blot, IP for phospho-Vegfr3 and IB detection with phospho-Vegfr3). Loading controls were: the IgG light chain [IgG(l)] present in all blots after IP (D, middle blot), and Myosin to monitor protein input in IPs (D, lower blot). Quantification of Vegfr3 phosphorylation (relative to the loading control) based on three independent experiments is shown in right-hand panel. The decrease in MO-ccbe1 compared with uninjected controls is statistically significant (P<0.05). (E) qPCR analysis of the expression of ccbe1, vegfr3, vegfc, kdr and kdrl in uninjected control and MO-ccbe1-, MO-vegfc-, and MO-vegfr3-injected embryos. Error bars represent s.d. (C) or s.e.m. (D,E).
|
