
Fig. 6
- ID
- ZDB-FIG-140417-5
- Publication
- Lu et al., 2014 - Overexpression of endothelin 1 triggers hepatocarcinogenesis in zebrafish and promotes cell proliferation and migration through the AKT pathway
- Other Figures
- All Figure Page
- Back to All Figure Page
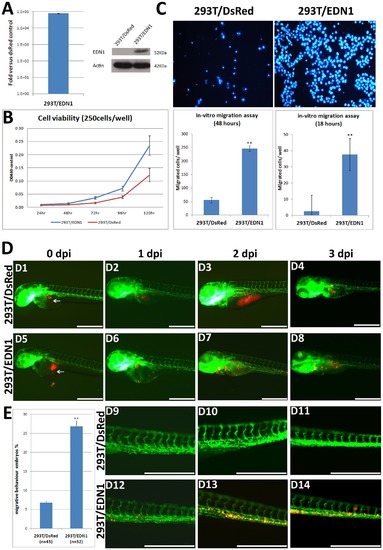
Stable EDN1 overexpression in 293T cells increases cell viability and migration. (A) EDN1 RNA and protein expression in cells stably overexpressing EDN1. Total RNA was isolated from the 293T/EDN1 and DsRed/293T control cells, and the mRNA expression level was determined by qPCR. Data are expressed as mean ± SD showing the ratio of the EDN1 expression in the overexpressed cells versus the control cells. The protein expression was analyzed by Western blotting using an EDN1 antibody. The EDN1 protein was expressed exclusively in the stable 293T/EDN1 cells. (B) A WST-1 assay to measure the viability of 293T/EDN1 cells (blue) and 293T/DsRed cells (red); 250 cells/well were seeded in 6-well plates, and the cell viability was measured at 1, 2, 3, 4 and 5 days after seeding. (C) A Transwell assay to assess the migration ability of 293T/EDN1 cells. The method is detailed in the Materials and Methods. The number of migrating 293T/DsRed control cells and 293T/EDN1 cells at 18 and 48 h are expressed as means ± SD of three independent experiment. (D) 293T/DsRed or 293T/EDN1 cells labeled with CM-Dil (red) were ectopically injected into the yolk sac of 2-dpf Tg(fli1:EGFP) zebrafish embryos. The fli1:EGFP embryos injected with 293T/DsRed control cells (D1–D4) and 293T/EDN1 cells (D5–D8) at 0, 1, 2, and 3 days post-injection (dpi) are shown at a low magnification. The fli1:EGFP embryos injected with 293T/DsRed cells (D9–D11) and 293T/EDN1 cells (D12–D14) at 1, 2, or 3 dpi are shown at a high magnification. Arrows indicate the primary injection site. Scale bar: 50 μm. (E) Quantification of the in-vivo cell migration. The percentage of the 3 dpi embryos showing migration behavior after xenotransplantation of 293T/DsRed cells (as a control) and 293T/EDN1 cells are shown. Forty-five and thirty-two two-day-old fli1:EGFP embryos were injected with DsRed/293T cells and 293T/EDN1 cells, respectively. These cells were examined at 3 dpi for migration behavior with a microscope. The data are presented as the means ± SD. **, P<0.001. |
| Gene: | |
|---|---|
| Fish: | |
| Anatomical Term: | |
| Stage Range: | Long-pec to Day 5 |