
Fig. 3
- ID
- ZDB-FIG-140421-25
- Publication
- Lu et al., 2014 - Overexpression of endothelin 1 triggers hepatocarcinogenesis in zebrafish and promotes cell proliferation and migration through the AKT pathway
- Other Figures
- All Figure Page
- Back to All Figure Page
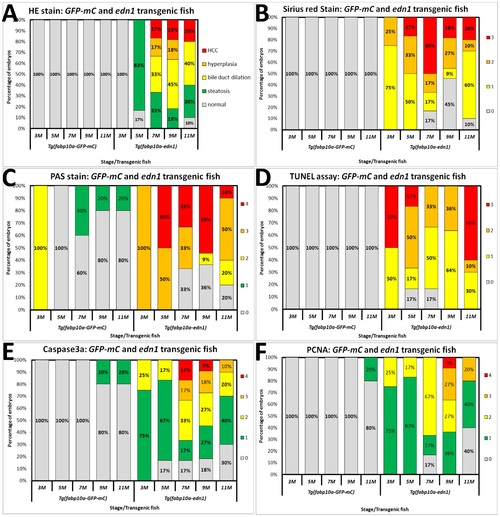
Comparison of hepatocyte histology from GFP-mCherry and edn1 transgenic fish from 3 to 11 months of age. Twenty-seven GFP-mCherry transgenic fish (as control) and thirty-seven edn1 transgenic fish were compared. H&E and additional staining methods were conducted on all the fish samples. (A) Statistical analysis of H&E staining. Different colors denote different pathological features: normal (gray), steatosis (green), bile duct dilation (yellow), hyperplasia (orange), and HCC (red). (B) Liver fibrosis was determined by Sirius Red staining. (C) Glycogen accumulation was identified by Periodic Acid-Schiff (PAS) staining. (D) Apoptosis was examined using the TUNEL assay. (E) Active caspase 3a and (F) Nuclear PCNA expression were assessed by IHC. Different colors represent different pathological scores. There are four possible scores for B and D: 0 (gray), 1 (yellow), 2 (orange), and 3 (red), and five possible scores: 0 (gray), 1 (green), 2 (yellow), 3 (orange), and 4 (red) for C, E and F. The y-axes correspond to “percentage of embryos”. |
| Fish: | |
|---|---|
| Observed In: | |
| Stage: | Adult |