
Fig. 6
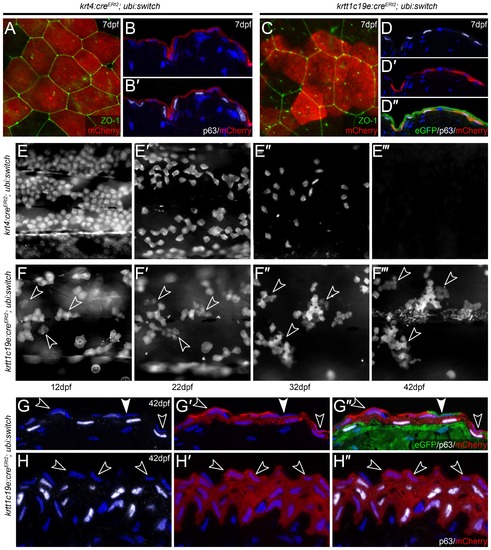
Embryonic EVL is lost and is replaced by cells from the basal epidermis during metamorphosis. A-D′′: Confocal images of lateral views (A, C) and transverse cryosections (B-B′, D-D′′) of krt4:CreERt2; ubi:swtch (A-B′) and krtt1c19e:CreERt2; ubi:swtch (C-D′′) at 5 dpf following 4-OHT mediated Cre conversion, and which have been immunofluorescently labelled with antibodies against mCherry (red; A-C, D′-D′′), ZO-1 (green; A, C), ”Np63 (white; B′, D, D′′) and eGFP (green; D′′) and counterstained with DAPI (blue; B-B′, D-D′′). Upon treatment of 4-OHT, krt4:CreERt2 drove recombination, and thus mCherry expression, in ZO-1-positive/”Np63-negative EVL cells (A-B′), whilst krtt1c19e:CreERt2 induced recombination in ΔNp63-positive/ZO-1-negative basal keratinocytes (C-D′′). E-F′′′: Time course of floxed krt4:CreERt2; ubi:swtch (E-E′′′) and krtt1c19e:CreERt2; ubi:swtch (F-F′′′) showing the same region of mCherry positive cells on the flank of representative individuals. Fluorescent images were taken at 12 dpf (E, F), 22 dpf (E′, F′) 32 dpf (E′′, F′′) and 42 dpf (E′′′, F′′′), and show that EVL cells are gradually lost, whilst clones of basal keratinocytes expand and stratify. n = 24 per genotype. G-H′′: Transverse cryosections of the trunk (G-G′′) and fin (H-H′′) epidermis of 42 hpf floxed krtt1c19e:CreERt2; ubi:switch transgenics, immunostained with antibodies against ΔNp63 (white; G, G′′, H, H′′), mCherry (red; G′-G′′, H′-H′′) and eGFP (green, G′′). Nuclei of all cells in the epidermis are marked by DAPI staining (blue; G-H′′). In contrast to 7 dpf (C-D′′), mCherry is now found in both suprabasal and the most superficial ΔNp63-negative cell layers (examples of the latter highlighted by open arrowheads). Occasional superficial cells, not derived from floxed basal cells, can be seen (green cell highlighted by closed arrowhead G-G′′). |
| Genes: | |
|---|---|
| Antibodies: | |
| Fish: | |
| Condition: | |
| Anatomical Terms: | |
| Stage Range: | Days 7-13 to Days 30-44 |