
Fig. 2
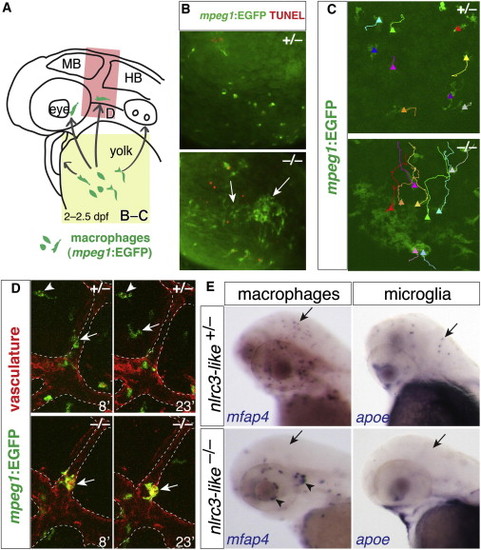
Aberrant Migration of Primitive Macrophages in nlrc3-like/ Mutants (A) Diagram shows the stereotypical migration route of macrophages from yolk sac to embryo proper (arrows). (B) Fluorescent images show abnormal active coalescence of yolk sac macrophages (mpeg1:EGFP+ in green, arrows) that overlap with apoptotic marker TUNEL in red in mutants (bottom panel; n = 12/12), which does not occur in wild-type (top panel; n = 11/11). Region of imaging is indicated by yellow box in (A). (C) Trajectories of individual yolk sac macrophages are shown using the MTrackJ cell-tracking tool, where the end point is indicated by a solid-triangle marker. See Movies S1 and S2 for the time-lapse series. (D) Time-lapse imaging shows the head region (red box in A) where macrophages are expected to migrate into the brain, using transient transgenesis of the mpeg1:EGFP construct labeling macrophages in green and the stable transgene kdrl:mCherry-CAAX to visualize the vasculature in red. Imaging shows macrophages entering the brain in wild-type siblings (top) but not mutant (bottom). The numbers indicate the time in minutes. In the top panels, the arrowhead points to a macrophage that has taken up residence in the brain to become a microglial cell; the arrow points to another macrophage migrating into the brain. In the bottom panels, the arrow points to a mutant macrophage that does not enter the brain and remains associated with vasculature (as demarcated by dotted lines). See Movies S3 and S4. (E) Whole-mount in situ hybridization at 2.5 dpf shows macrophage mfap4+ and microglial apoe+ cells in wild-type heterozygous embryos (arrows), but not in mutants (arrows). Aberrant macrophage clusters form near cranial vasculature in mutants (arrowheads). MB, midbrain; HB, hindbrain. |
| Genes: | |
|---|---|
| Fish: | |
| Anatomical Terms: | |
| Stage Range: | Long-pec to Pec-fin |
| Fish: | |
|---|---|
| Observed In: | |
| Stage Range: | Long-pec to Pec-fin |