
Fig. 2
- ID
- ZDB-FIG-130912-21
- Publication
- Tse et al., 2013 - Early embryogenesis in zebrafish is affected by bisphenol A exposure
- Other Figures
- All Figure Page
- Back to All Figure Page
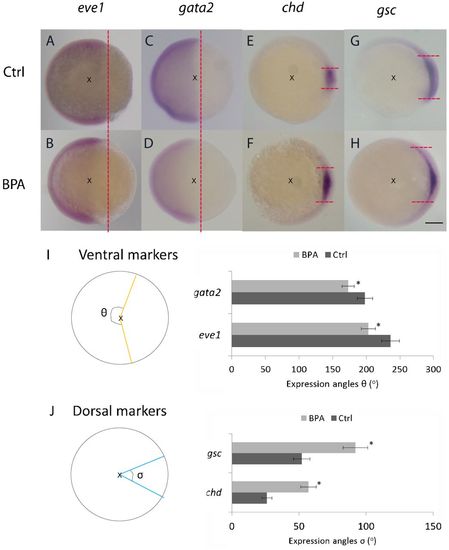
Bisphenol A affects dorsal–ventral patterning at the 60–75% epiboly stage. Embryos exposed to bisphenol A (BPA) showed narrower expression pattern for the ventral markers eve1 and gata2 (A–D), but wider expression pattern for the dorsal markers chd and gsc (E–H). Red dotted lines indicate the normal expression margin of the ventral markers (ventricle) or dorsal (horizontal) in both BPA-exposed and control embryos. Images were captured in the lateral view (A–D) and animal pole view (E–H), dorsal towards the right in the 60–75% epiboly stage. Scale bar: 250μm. Schematic diagrams indicate the expression angles of different markers. x marks the center of the embryos, angle of expression of different in situ markers in control and BPA-exposed embryos. θ indicates the angles of the ventral markers (eve1/gata2) with orange lines (I), while σ represents the angles of the dorsal markers (chd/gsc) with blue lines (J). The angles represent the mean of 20 embryos. The expression angles of the ventral markers were smaller (I) but those of the dorsal markers were larger (J), which represents the dorsalization phenotype (*P<0.05). |