
- Title
-
Early embryogenesis in zebrafish is affected by bisphenol A exposure
- Authors
- Tse, W.K., Yeung, B.H., Wan, H.T., and Wong, C.K.
- Source
- Full text @ Biol. Open
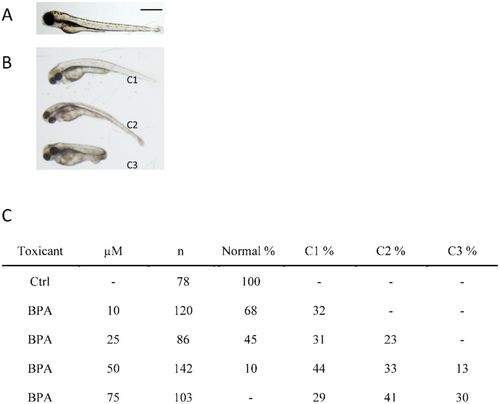
Morphology and phenotypic frequency of 3-day post-fertilized embryos exposed to bisphenol A. Bisphenol A (BPA)-exposed embryos in an AB wild-type zebrafish showed mild dorsalized phenotypes at 3 days post-fertilization. The control embryos were treated with DMSO (A). BPA exposed embryos showed C1 to C3 mild dorsalization phenotypes (B). Scale bar: 650µm. Phenotypic frequency is indicated in panel C. C1–C3 phenotypes represent dorsalized phenotype as described (Tse et al., 2009; Mullins et al., 1996). n, number of scored embryos. |
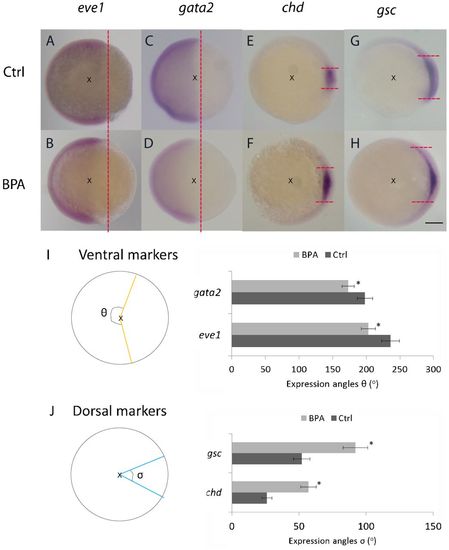
Bisphenol A affects dorsal–ventral patterning at the 60–75% epiboly stage. Embryos exposed to bisphenol A (BPA) showed narrower expression pattern for the ventral markers eve1 and gata2 (A–D), but wider expression pattern for the dorsal markers chd and gsc (E–H). Red dotted lines indicate the normal expression margin of the ventral markers (ventricle) or dorsal (horizontal) in both BPA-exposed and control embryos. Images were captured in the lateral view (A–D) and animal pole view (E–H), dorsal towards the right in the 60–75% epiboly stage. Scale bar: 250μm. Schematic diagrams indicate the expression angles of different markers. x marks the center of the embryos, angle of expression of different in situ markers in control and BPA-exposed embryos. θ indicates the angles of the ventral markers (eve1/gata2) with orange lines (I), while σ represents the angles of the dorsal markers (chd/gsc) with blue lines (J). The angles represent the mean of 20 embryos. The expression angles of the ventral markers were smaller (I) but those of the dorsal markers were larger (J), which represents the dorsalization phenotype (*P<0.05). |
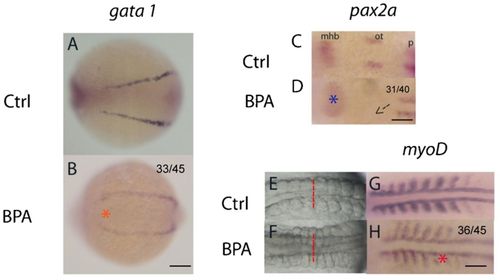
Bisphenol A alters somite formation at the 8–10 somite stage. Lateral expansion of the presumptive hematopoietic cell marker (gata 1) was indicated by an orange asterisk, which indicates the dorsalized phenotype in the bisphenol A (BPA)-exposed embryos (A,B). pax2a expression at the 8–10 somite stage, dorsal view (C,D). A blue asterisk indicates abnormal developmental pattern in the mid-hindbrain boundary (mhb) in BPA-exposed embryos. Additionally, an arrow marks the missing of the 2 otic vesicles in BPA-exposed embryos (D). Somite morphology of the control (E) and the BPA-exposed embryos (F) at the 8–10 somite stage. Lateral expansion of somite muscles was observed (red dotted lines). The somite marker, myoD, showed widened and diffused expression in the BPA-exposed embryos (red asterisk) as compared to the control (G,H). mhb, mid-hindbrain boundary; ot, otic vesicle; p, pronephric precursor expression domain. All were head to the left. Scale bars: 75μm (A,B); 200μm (C,D); 150μm (E–H). The number of embryos with the presented phenotype is shown in the top right corner of the panel. |
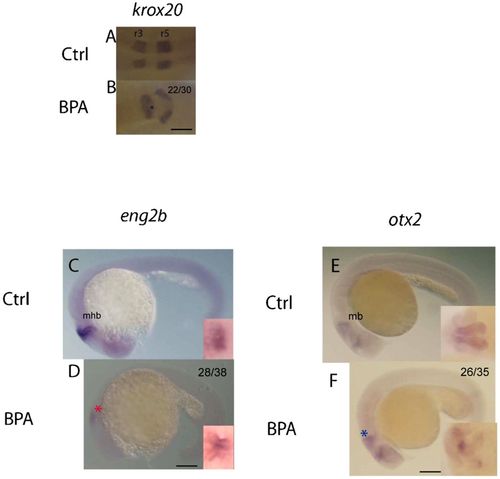
Bisphenol A influences brain development in the prim-5 stage. The expression patterns of markers in different brain regions (krox20, eng2b, and otx2) at the prim-5 stage are shown. The expression of krox20, a marker of rhombomeres 3 and 5, dorsal view (A,B). Abnormal patterning of rhombomeres 3 and 5 (black asterisk) was found in BPA-exposed embryos (B), which indicates that regionalization was affected. The patterns of eng2b expression indicated that the mid-hindbrain boundary (mhb) was minimized in the BPA-exposed embryos (red asterisk). Compared to the controls (C), BPA-exposed embryos showed a smaller mhb (D), lateral view; magnified views of the dorsal region are shown in the inserts at the right bottom corner. otx2 expression pattern was restricted in the BPA-exposed embryos (blue asterisk). Compared to the controls (E), the BPA-exposed embryos (F) showed reduced size of the midbrain. Magnified views of the dorsal section are shown in the corner. mb, midbrain; mhb, mid-hindbrain boundary; r3/r5, rhombomere 3/5. All were head to the left. Scale bars: 100μm (A,B); 125μm (C–F). The number of embryos with the presented phenotype is shown in the top right corner of the panel. |