
Fig. S3
- ID
- ZDB-FIG-130808-46
- Publication
- Jászai et al., 2013 - Spatial Distribution of Prominin-1 (CD133) - Positive Cells within Germinative Zones of the Vertebrate Brain
- Other Figures
- All Figure Page
- Back to All Figure Page
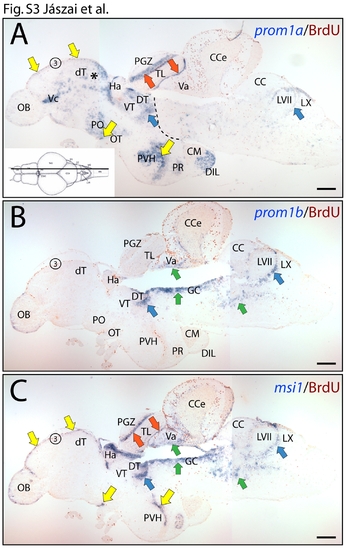
The combined expression of prominin-1a and b mimics distribution of musashi-1 in adult zebrafish brain. (A–C) Cryosections of 3-month-old adult brain from BrdU-treated zebrafish were processed for ISH using an antisense DIG-labelled probe either against prominin-1a (A; prom1a), prominin-1b (B; prom1b) or musashi-1 (C; msi1). Proliferating cells were observed by immuno-detection of BrdU (brown). Position of paramedian sections of the brain is indicated on the cartoon (A) adapted from a standard neuroanatomical atlas by Wulliman and colleagues [104]. Coloured arrows indicate overlapping expression domains of particular genes. Black dashed line indicates the border of prosencephalon towards the tegmentum of the brainstem (A). Major sites of prominin-1a (A) expression are located in the prosencephalic and tectal domains overlapping partly with msi1 (C) in certain subdivisions of the dorsal telencephalic surface proliferative zone (3), in a subdivision of the preoptic area (PO) located above the optic tract (OT), in the periventricular hypothalamus (PVH), in the periventricular grey zone (PGZ) and torus longitudinalis (TL). Expression of prominin-1a extends laterally into msi1–negative areas including the extraventricular parenchyma of the dorsal telencephalon (dT, asterisk), central parts of the ventral telencephalic area (Vc) and diffuse nucleus of the hypothalamic inferior lobe (DIL). Prominin-1b (B) overlaps with msi1 (C) in the periventricular rhombencephalon (griseum centrale, GC) and valvula cerebelli (Va). All three genes are detected in the dorsal thalamus (DT) and in the facial lobe (LVII). CC, crista cerebellaris; CCe, Corpus cerebelli; CM, corpus mamillare; Ha, habenula; LX, vagal lobe; OB, olfactory bulb; PR, posterior recessus of the diencephalic ventricle; VT, ventral thalamus. Scale bars, A–C, 250 μm. |
| Genes: | |
|---|---|
| Fish: | |
| Anatomical Terms: | |
| Stage: | Adult |