
Fig. S7
- ID
- ZDB-FIG-130607-4
- Publication
- Matsuda et al., 2013 - Lef1 regulates Dusp6 to influence neuromast formation and spacing in the zebrafish posterior lateral line primordium
- Other Figures
- All Figure Page
- Back to All Figure Page
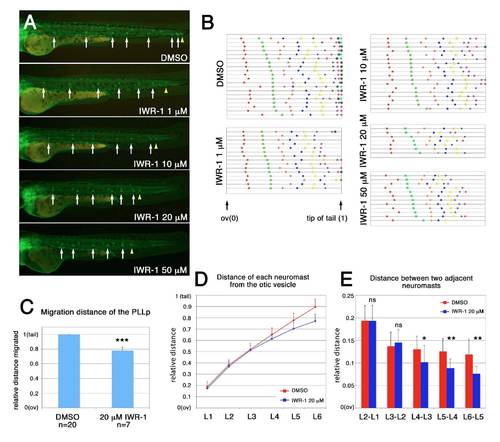
Statistical analysis of changes in PLLp migration following different manipulations. (A) Patterns of neuromast deposition at 48 hpf in embryos treated with different doses of IWR-1. White arrows indicate deposited neuromasts and yellow arrowheads indicate the end of the PLLp migration. (B) Patterns of neuromast deposition in individual embryos. Individual embryos are represented on separate lines in an order determined by the relative position of L2. (C) Migration distance of the PLLp in DMSO and IWR-1 treated embryos at 48 hpf. Data are presented as the average ± s.d. ***P<0.001. (D) Average position of each deposited neuromast in embryos treated with DMSO or IWR-1. x-axis represents deposited neuromasts, L1 to L6, and y-axis represents distance of each deposited neuromast relative to the distance from the otic vesicle to the tip of the tail. (E) Distance between two adjacent neuromasts deposited in embryos treated with DMSO or 20 μM IWR-1. Data are presented as the average ± s.d. Statistical significance of the differences between each pair of groups was determined by Student’s t-test. *P<0.05, **P<0.01, ***P<0.001; ns, not significant. |