
Fig. 1
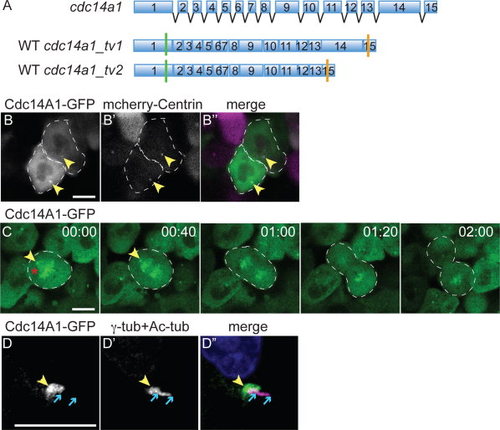
Dynamic distribution of Cdc14A1 during the cell cycle at 8 hpf. A: Structure of cdc14a1 gene and wild-type (WT) transcripts. Green bars indicate translation start codons and orange bars indicate in frame stop codons. B-D: Localization of Cdc14A1 in the ectoderm of live embryos at 8 hpf (B,C) and fixed embryos at 14 hpf (D). B: The embryo was injected with synthetic cdc14a1_tv1-GFP (B, green in B′′) and mcherry-centrin (B′, purple in B′′) RNAs. Dashed lines delimit two cells in interphase. C: Dividing cell proceeding through metaphase (00:00), anaphase (00:40-01:20), and telophase (2:00). Dashed lines delimit the mitotic cell. D: The embryo was injected with synthetic cdc14a1_tv1-GFP RNA and stained using antibodies against GFP (D, green in D′′), γ-tubulin and acetylated tubulin (D′, purple in D′′). Yellow arrowheads point to the centrosomes. Red asterisk indicates the mitotic spindle. Blue arrows delimit the ends of the cilium. Scale bars = 10 μm. |