
Fig. 3
- ID
- ZDB-FIG-120725-42
- Publication
- Vasilyev et al., 2012 - Mechanical Stretch and PI3K Signaling Link Cell Migration and Proliferation to Coordinate Epithelial Tubule Morphogenesis in the Zebrafish Pronephros
- Other Figures
- All Figure Page
- Back to All Figure Page
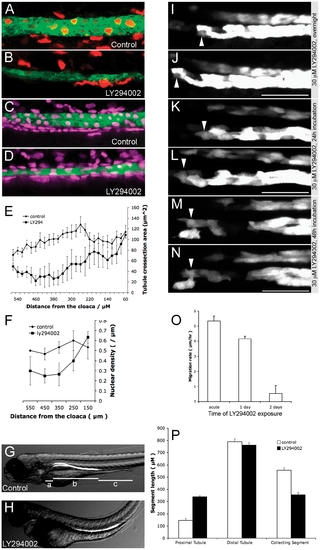
Distal proliferation supports prolonged epithelial migration. (A–D) 1.5 µm confocal slices of the distal tubule. Green: GFP (ET11-9 GFP transgenic in A–B, Tg(atp1a1a.4:GFP) transgenic in C&D). Red: BrdU. Magenta: DAPI. (A) BrdU incorporation in the distal tubule (2–3 dpf) in control fish. (B) Lack of BrdU incorporation in distal tubule between (2–3 dpf) when embryo is treated with 30 µM LY294002. Cells outside of the kidney continued to incorporate BrdU. (C) DAPI staining of distal tubule in control fish (4 dpf). (D) DAPI staining of distal tubule treated with 30 µM LY294002 (4 dpf). The distal tubule was markedly thinned in LY294002 condition (B, D). (E) estimated cross-sectional tubule area based on measured maximal diameter of the tubule in confocal stacks at 3 dpf. Circles: control (n = 5). Squares: LY294002 treated fish (n = 3). (F) Linear nuclear density (DAPI) in control fish (circles, n = 3) and LY294002 treated fish (squares, n = 3) confirmed linear stretching of the distal tubule in Ly294002 treated fish (4 dpf). (G, H) Kidney segment lengths in (G) control fish and (H) LY294002 treated fish at 4dpf. ET11-9 transgenic fish were used to estimate the segment lengths: ‘a’, ‘b’ and ‘c’ represent proximal tubule, distal tubule and the pronephric duct. (I–N) Individual frames of time lapse movies of the actively migrating pronephric epithelia in the presence of 30 µM LY294002. Arrowheads point to the individual traced cells. Time lapse immediately after addition of LY294002 (I, J), 24 hours after addition of LY294002 (K, L), and 48 hours after addition of LY294002 (M, N). Frame pairs in I and J, K and L, and M and N are separated by 6 hours. (O) Average epithelial migration rates after different durations of LY294002 exposure. Each bar represents average migration rate of 4 different individual cells in the proximal tubule (ET11-9:GFP). (P) Lengths of proximal tubule (designated ‘a’ in G), distal tubule (designated ‘b’ in G) and pronephric duct (designated ‘c’ in G) in control 96 hpf fish and fish treated with 30 μM LY294002 starting at 30 hpf. White bars: control (n = 9), black bars: LY294002 (n = 9). See also Figure S2. |