
FIGURE
Fig. 6
- ID
- ZDB-FIG-120203-3
- Publication
- Weiner et al., 2012 - Fishing the molecular bases of Treacher Collins syndrome
- Other Figures
- All Figure Page
- Back to All Figure Page
Fig. 6
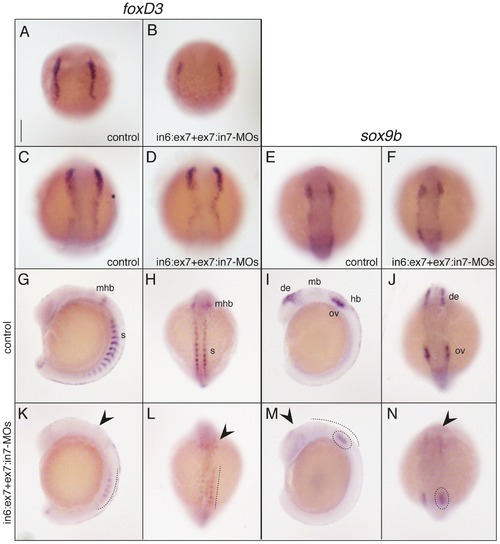
Zebrafish tcof1 morphants showed reduced NC-specifier gene expression patterns. Lateral (G, I, K, and M) and dorsal (A–F, H, J, L, and N) views of control (A, C, E, and G–J) and in6:ex7-MO+ex7:in7-MO-treated (B, D, F, K–N) embryos. Embryos at 14 hpf were analyzed for foxD3 (A–B and E–F) and sox9b (C–D and G–H) expression patterns using whole-mount in situ hybridization. Abbreviations: de, diencephalic; hb, hindbrain; mb, midbrain; mhb, mid-hindbrain; ov, otic vesicles; s, somites. Scale bar: 185 μm for A–N. |
Expression Data
| Genes: | |
|---|---|
| Fish: | |
| Knockdown Reagents: | |
| Anatomical Terms: | |
| Stage Range: | 1-4 somites to 10-13 somites |
Expression Detail
Antibody Labeling
Phenotype Data
Phenotype Detail
Acknowledgments
This image is the copyrighted work of the attributed author or publisher, and
ZFIN has permission only to display this image to its users.
Additional permissions should be obtained from the applicable author or publisher of the image.
Full text @ PLoS One