
Fig. 1
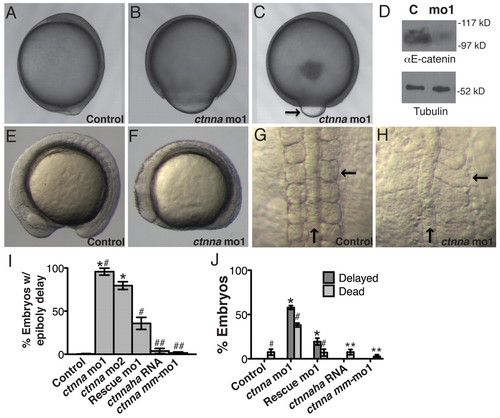
ctnna morphants display morphological defects. (A-C) DIC images of live zebrafish embryos at the end of gastrulation. Arrow indicates yolk bulge. (D) Western blot of αE-catenin and tubulin in whole-embryo extracts at the same stages as those shown in A-C. (E,F) Lateral view images of live embryos at the mid-segmentation stage. (G,H) Images of live embryos, dorsal view. Horizontal arrow indicates somite, vertical arrow indicates notochord. (I) Percentage of embryos exhibiting epiboly delay at the end of gastrulation, as shown in B,C. Three independent experiments with n>70: *P<10–6 versus control, #P<10–5 versus rescue. ##, not significantly different from control by Student’s t-test. (J) Fraction of embryos dead or delayed by mid-segmentation, as shown in E,F. Three independent experiments, n>70 embryos. *P<10–6, # control or rescue vs morphant P<10–5. **, not significant. Error bars indicate s.d. |
| Fish: | |
|---|---|
| Knockdown Reagents: | |
| Observed In: | |
| Stage Range: | Bud to 10-13 somites |