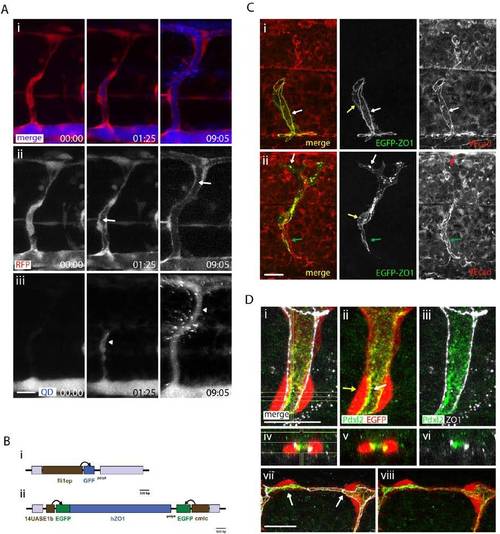
QD Labeling of the Lumen and Characterization of fli1ep:Gal4ffubs3;UAS:ZO1-EGFPubs5 Transgenic Lines, Related to Figure 1
(A) Lumen formation can be visualized by quantum dot (QD) injection and indirectly by a lack of RFP fluorescence. Picture series from a movie (data not shown). (i) merged images, (ii) RFP, (iii) QD. QD injected into the sinus venosus spread in the circulation visualizing patent lumens. Initially, QD are restricted to the dorsal aorta (DA) (time 00:00 in iii). Later the lumen is successively filled from the DA through the ISV and the DLAV (arrowheads in iii). The distribution of QD in the ISV correlates with a displacement of cytoplasm, which also correlates with a reduction of the cytoplasmic RFP signal (arrows in ii).
(B) DNA Gal4ff-driver and UAS-responder constructs used to generate transgenic reporter lines: Tol2 transposon sequences are shown as grey boxes. (i) schematic of the pT2fli1ep:GAL4FF driver construct, (ii) schematic of pT2UAS:EGFP-hZO1-cmlc2:EGFP responder construct.
(C) EGFP-ZO1 colocalizes with endogenous VE-cad. (i) shows a stalk cell and (ii) shows a tip cell, where both proteins colocalize along cell junctions and presumptive autocellular contact points (white arrows). Since expression of EGFP-ZO1expression is mosaic, some VE-cad positive junctions are not labeled by EGFP-ZO1 (green arrows). Delocalized ZO1-EGFP protein is found in the cell membrane (yellow arrow).
(D) Luminal localization of Pdxl2 in the zebrafish vasculature. Optical sections through an ISV at 38hpf showing the distribution of apical and junctional staining in ECs. Sagittal (i-iii) and cross (iv-vi) sections are indicated by crosshairs (i, iv). Pdxl2 is visible only in the luminal site i.e. the apical side (white arrow in ii) of the cells and not the basal side (yellow arrow in ii). In (vii-viii) the Pdxl2 apical membrane staining in the DLAV at 36 hpf present throughout the cell (left arrow) indicates transcellular lumen formed by a cell invagination process. The Podocalyxin2 apical membrane staining between the junctions (white arrow) indicates extracellular lumen formation by cell rearrangements. (i-viii) ZO1 (white) and Pdxl2 (green) immunolocalization on Tg(kdrl:EGFP S843) (red) embryos. The scale bar in all panels represents 20 μm.
|
