
Fig. 5
- ID
- ZDB-FIG-111128-16
- Publication
- Gupta et al., 2011 - Zebrafish transgenic lines co-expressing a hybrid Gal4 activator and eGFP in tissue-restricted patterns
- Other Figures
- All Figure Page
- Back to All Figure Page
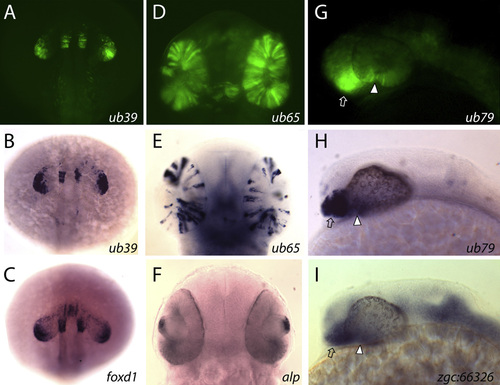
SAGVG lines and endogenous zebrafish genes with corresponding expression patterns. Dorsal-anterior views comparing ub39 eGFP labeling (A) and eGFP mRNA distribution (B) to the distribution of foxd1 transcripts (C) at 1 dpf. Comparison of ub65 eGFP labeling (D) and mRNA distribution (E) to the distribution of alp transcripts (F) at 2 dpf (D is a ventral view and E,F are dorsal views). Lateral views comparing ub79 eGFP labeling (G) and mRNA distribution (H) to the distribution of zgc:66326 transcripts (I) at 1 dpf. Arrows and arrowheads in G-I indicate areas of expression in the hypothalamus and choroid fissure, respectively. |
| Genes: | |
|---|---|
| Fish: | |
| Anatomical Terms: | |
| Stage Range: | Prim-5 to Long-pec |
Reprinted from Gene expression patterns : GEP, 11(8), Gupta, P., Zhao, X.F., Prat, C.R., Narawane, S., Suh, C.S., Gharbi, N., Ellingsen, S., and Fjose, A., Zebrafish transgenic lines co-expressing a hybrid Gal4 activator and eGFP in tissue-restricted patterns, 517-24, Copyright (2011) with permission from Elsevier. Full text @ Gene Expr. Patterns