
Fig. 2
- ID
- ZDB-FIG-100816-21
- Publication
- Tong et al., 2010 - Zebrafish monosex population reveals female dominance in sex determination and earliest events of gonad differentiation
- Other Figures
- All Figure Page
- Back to All Figure Page
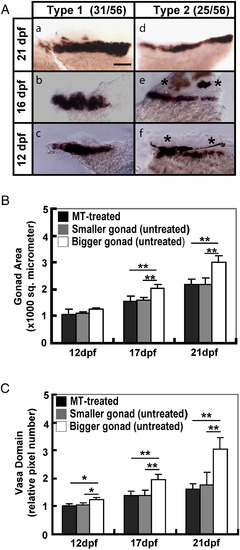
Comparison of the gonad size of MT-treated and wildtype juveniles. (A) Whole mount in situ RNA hybridization of vasa in two typical sets of gonads. Examples of the type 1 with fat gonads (a, b, c) and type 2 with slender gonads (d, e, f) at larvae of 21, 16 and 12 dpf are shown. The scale bar represents 100 μm. (B) Areas of gonads and (C) expression domains of vasa from MT-treated and two groups of wildtype juveniles are compared at 12, 17, and 21 dpf. The average intensity of 12-dpf MT-treated gonads is taken as 100. The number in parentheses in (A) indicates the number of gonads with a typical shape versus the total number of gonads. Asterisks in (A) demonstrate the pigment near the gonads. *P < 0.05, **P < 0.01. |
| Gene: | |
|---|---|
| Fish: | |
| Anatomical Terms: | |
| Stage Range: | Days 7-13 to Days 21-29 |
Reprinted from Developmental Biology, 344(2), Tong, S.K., Hsu, H.J., and Chung, B.C., Zebrafish monosex population reveals female dominance in sex determination and earliest events of gonad differentiation, 849-856, Copyright (2010) with permission from Elsevier. Full text @ Dev. Biol.