
Fig. 6
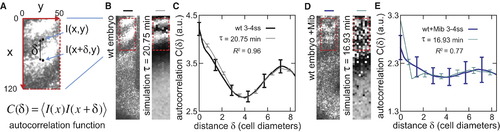
Coupling Time Delays Regulate the Stability of the Segmentation Clock (A) Schematic of how the autocorrelation function (Equation 6, Experimental Procedures) is computed. A magnification of the gene expression pattern from (B) is shown, together with the reference axes x and y in pixels, and the distance δ between two sample points of gene expression intensity I. (B) Representative cyclic dlc expression in PSM of wild-type embryo and DCT simulation with wild-type parameters defined in this work, black dot in Figure 5C. (C) Average autocorrelation function of spatial patterns in red box from (B): n (embryos) = 15, black line; n (simulations) = 20, gray line. Error bars show standard error of the mean (SEM). (D) Representative experimental Mib overexpression (400 pg mRNA) and corresponding DCT simulation with reduced coupling delay, blue dot in Figure 5C. (E) Average autocorrelation function of spatial patterns in red box from (D): n (embryos) = 8, dark blue line; n (simulation) = 20, light blue line. The arbitrary units in the correlation axis are multiplied by 10-3. Figures S5 and S6 show the autocorrelations for decreasing delays in numerical simulations and increasing levels of Mib overexpression in the Figure S7 shows that the Delta-Notch loss-of-coupling mutants have autocorrelation functions distinct from Mib overexpression. Error bars show SEM. |
| Gene: | |
|---|---|
| Fish: | |
| Anatomical Term: | |
| Stage: | 10-13 somites |