
Fig. 4
- ID
- ZDB-FIG-100322-7
- Publication
- Tobin et al., 2010 - The lta4h Locus Modulates Susceptibility to Mycobacterial Infection in Zebrafish and Humans
- Other Figures
- All Figure Page
- Back to All Figure Page
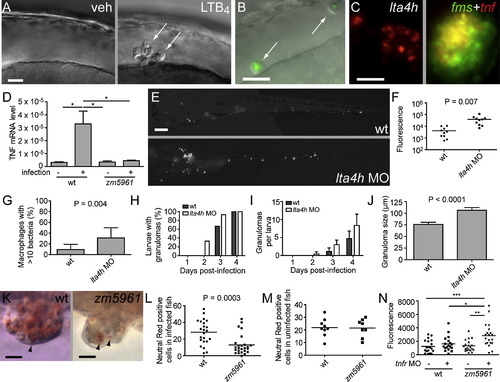
lta4h Deficiency Compromises TNF Induction and Phenotypically Resembles TNF Signaling Deficiency (A) DIC image of HBV of 30 hpf-embryo 6 hr post-injection with vehicle (left) or 1.5 x 10⁻¹⁴ mol LTB4 (right). Arrows, macrophages. (B) Fluorescence and DIC overlay image of HBV of 30 hpf mutant fh112 embryo (obtained from incross of fh112/+ heterozygotes) 6 hr post-injection with GFP-expressing Mm. Arrows, infected macrophages. After scoring for macrophage recruitment, genotype of embryos was identified based on cording phenotype at 4 dpi. The scale bar represents 20 μm. (C) lta4h FISH showing staining of an early-stage granuloma 2 dpi (left); dual FISH showing tnf expression in macrophages of 4 dpi granuloma macrophages by demonstrating colocalization of the macrophage marker fms (green) and tnf (red). The scale bar represents 20 μm. (D) Relative TNF mRNA levels (relative to a β-actin standard) assessed by qRT-PCR at 1 dpi following infection of 30 WT or zm5961 larvae with 93 WT bacteria. Error bars represent the SEM. Representative of two independent experiments. (E) Representative fluorescence images of control (top) or lta4h morphant (bottom) animals 3 dpi with 130 erp mutant bacteria. (n = 10 for each condition.) The scale bar represents 20 μm. (F) Quantification of bacterial burdens by fluorescence pixel counts (FPC) of all animals from (D) at 6 dpi. (G) Proportion of single macrophages containing > 10 bacteria in 15 control and 12 lta4h morphant animals at 3 dpi with 130 erp mutant bacteria. Error bars represent the SD. (H–J) Serial assessment of granuloma formation in control (dark bars) and lta4h morphants (light bars) injected with 230 bacteria (n = 15 each) by fluorescence and DIC microscopy for 4 dpi. (H) Percentage of animals with at least one granuloma over time. lta4h morphants form granulomas earlier; they are significantly more likely to have at least one granuloma than WT at 2 dpi (p = 0.042; Fisher′s exact test). (I) Average number of granulomas per fish over time. p < 0.001 when comparing both time post-infection and morphant status by two-way ANOVA. Error bars represent the SD. (J) Morphometric analysis of control MO (WT) and lta4h MO granuloma size at 4 dpi; error bars represent the SEM. (K) Neutral red labeling of granuloma macrophages in WT and zm5961 granulomas. Arrowheads indicate examples of neutral red positive macrophages. Fish were infected with approximately 250 bacteria then neutral red stained at 4 dpi, six dpf. The scale bar represents 10 μm. (L) Numbers of neutral red stained cells in the tails of infected WT and zm5961 fish infected as described in (K). p = 0.0003 (Student′s unpaired t test). (M) Quantitation of neutral red stained cells in the tails of uninfected WT and zm5961 fish at 6 dpf. (N) Bacterial burdens (FPC) at 4 dpi with 75 bacteria in control or TR1 morphants in the background of either WT or zm5961 animals. *p < 0.05; **p < 0.01; ***p < 0.001. (one-way ANOVA with Tukey′s post-test; all other comparisons not significant). See also Figure S2, Figure S3, and Movie S1. |
Reprinted from Cell, 140(5), Tobin, D.M., Vary, J.C. Jr, Ray, J.P., Walsh, G.S., Dunstan, S.J., Bang, N.D., Hagge, D.A., Khadge, S., King, M.C., Hawn, T.R., Moens, C.B., and Ramakrishnan, L., The lta4h Locus Modulates Susceptibility to Mycobacterial Infection in Zebrafish and Humans, 717-730, Copyright (2010) with permission from Elsevier. Full text @ Cell