
Fig. 5
- ID
- ZDB-FIG-100309-33
- Publication
- Gutzman et al., 2010 - Epithelial relaxation mediated by the myosin phosphatase regulator Mypt1 is required for brain ventricle lumen expansion and hindbrain morphogenesis
- Other Figures
- All Figure Page
- Back to All Figure Page
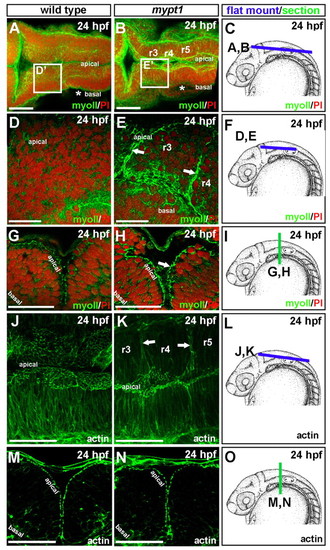
Abnormal localization of non-muscle myosin II and actin in mypt1 mutants. (A-I) Wild-type and mypt1 mutant zebrafish embryos were stained with non-muscle myosin II antibody (green) and counterstained with propidium iodide to label nuclei (red). Representative images from four independent experiments. For each experiment, two to three embryos were imaged. (A,B) 3D projection of a whole-mount wild-type (A) or mypt1 mutant (B) embryo at 24 hpf. (C) Diagram of region imaged in A and B. (D,E) Wild type (D) and mypt1 mutant (E) at 24 hpf mounted after removal of the roof plate, imaging the boxed region labeled D′ in A or E′ in B. (F) Diagram of region imaged in D and E. (G,H) Vibratome section of a 24 hpf wild-type (G) or mypt1 mutant (H) embryo. (I) Region of the embryo sectioned for G and H. (J-O) Wild type and mypt1 mutants stained with phalloidin (green). Representative images from two independent experiments. For each experiment, three to four embryos were imaged. (J,K) 3D projection of a whole-mount wild-type (J) or mytp1 mutant (K) embryo at 24 hpf. (L) Diagram of region imaged in J and K. (M,N) Vibratome section of a wild-type (M) or mypt1 mutant (N) embryo at 24 hpf. (O) Diagram of embryo imaged in M and N. Scale bars: 50 μm in A,B,G,H,J,K,M,N; 25 μm in D,E. |