
Fig. 2
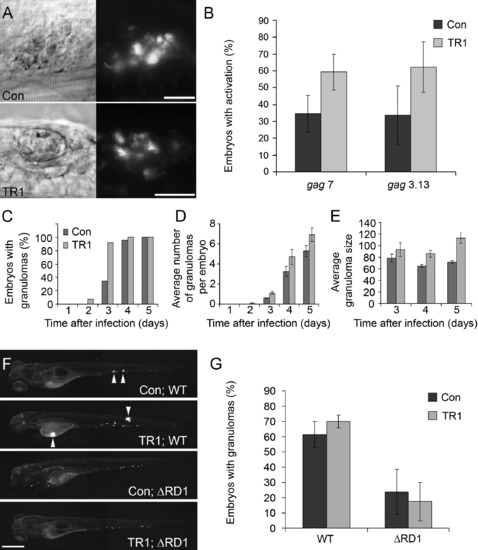
Granulomas Form More Quickly in the Absence of TNF Signaling (A) DIC (left) and fluorescence (right) images of granuloma. Activated genes (gag3.13) in granulomas in both control and morphant embryos are shown as percentage of embryos with activation of fluorescent reporters ± the standard deviation of the mean. Scale bars represent 25 μm. (B) Three pools of ∼30 embryos were injected with 56 ± 18 CFU of gag7, and four pools of ∼30 embryos were injected with 64 ± 17 CFU of gag3.13. All groups were scored at 4 dpi for induction of gags as indicated by fluorescent activity. The average percentage of embryos with gag induction is plotted ± standard deviation of the mean. Averages for both gag7 and gag3.13 are significantly different between controls and morphants (p < 0.05, Student's unpaired t test). (C–E) 23 Control and 14 TR1 morphant embryos were injected with 89 ± 4 CFU and followed sequentially for 5 dpi and monitored for granuloma formation and size. All dark bars represent control morphant data; light bars represent TR1 morphant data. Data are plotted as average ± standard error of the mean. (C) shows the percentage of embryos with at least one granuloma over time. TR1 morphant embryos have significantly more granulomas at 3 dpi (p < 0.01) as analyzed by Fisher's exact test of a contingency table. (D) shows the average number of granulomas identified by DIC and fluorescent microscopy over time. (E) shows that TR1 morphant granulomas are significantly larger than control granulomas (p < 0.05 at 3 dpi, p < 0.0001 at 4 and 5 dpi by Student's unpaired t test, n = 14; control and 14 TR1 granulomas at 3 dpi, 75 control and 53 TR1 granulomas at 4 dpi, and 113 control and 72 granulomas at 5 dpi). The y axis represents granuloma diameter in μm. (F and G) Pools of 20 embryos were injected with 27 ± 6 wild-type (WT) and 51 ± 13 ΔRD1 M. marinum and assayed by microscopy at 4 dpi for granuloma formation. (F) shows representative images of control and TR1 morphant embryos. Arrowheads indicate granulomas. The scale bar represents 200 μm. As shown in (G), the average percentage of embryos with granulomas is plotted ± standard deviation of the mean over four biological replicates. The percentage of embryos with granulomas is significantly higher when injected with WT (p < 0.01 for Con; WT versus Con; ΔRD1 and p < 0.001 for TR1; WT versus TR1; ΔRD1 by Student's unpaired t test). |
| Fish: | |
|---|---|
| Condition: | |
| Knockdown Reagents: | |
| Observed In: | |
| Stage Range: | Long-pec to Day 6 |
Reprinted from Immunity, 29(2), Clay, H., Volkman, H.E., and Ramakrishnan, L., Tumor necrosis factor signaling mediates resistance to mycobacteria by inhibiting bacterial growth and macrophage death, 283-294, Copyright (2008) with permission from Elsevier. Full text @ Immunity