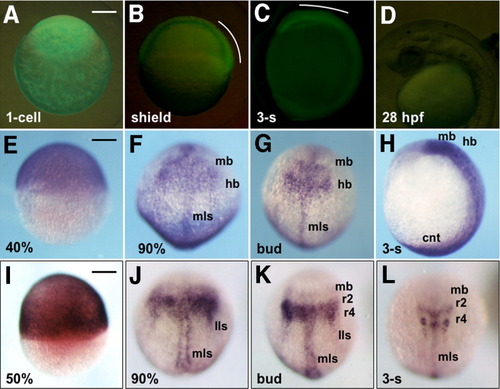
Stable expression of GFP-6.5 in transgenic embryos. A-C: Expression of GFP-6.5 as visualized with green fluorescent protein (GFP) fluorescence in a fertilized egg (A), or in developing embryos at the shield (B) and three-somite (C) stages. D: GFP expression could not be detected at 28 hours postfertilization (hpf) in the head. GFP expression in the dorsal blastoderm and head regions is marked with white curves. E-H: Expression of GFP-6.5 mRNA, detected by whole-mount in situ hybridization, in embryos at 40% epiboly (E), 90% epiboly (F), bud (G), and three-somite (H) stages. I-L: Endogenous expression of pou2 at 50% epiboly (I), 90% epiboly (J), bud (K), and three-somite stages (L). A,E,I: Lateral views with animal poles to the top. B-D,H: Lateral views with anterior to the top and dorsal to the right (B,C,H) or with anterior to the left and dorsal to the top (D). F,G,J-L: Dorsal views with anterior to the top. cnt, caudal neural tube; hb, hindbrain; lls, lateral longitudinal stripe; mb, midbrain; mls, medial longitudinal stripe. Scale bar = 200 μm.
|
