|
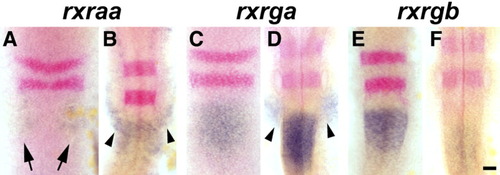
Neural expression of zebrafish rxr genes. ISH reveals distinct patterns of rxr gene expression within and near the neural tube. Dorsal views of flatmounted embryos; rxr gene expression is depicted in blue, and krox20, indicating r3 and r5, is shown in red. A: At the 5-somite stage, rxraa is expressed in lateral regions of anterior spinal cord (arrows). B: At the 18-somite stage, rxraa is expressed in the neural crest (arrowheads). C: At the 5-somite stage, rxrga is expressed in the anterior spinal cord. D: At 24 hpf, rxrga is expressed in the anterior spinal cord and the neural crest (arrowheads). E: At the 10-somite stage, rxrgb is expressed in the anterior spinal cord. F: At 24 hpf, rxrgb is expressed at low levels in medial anterior spinal cord. Scale bar = 10 μm.
|