
Fig. 1
- ID
- ZDB-FIG-061002-6
- Publication
- Conway, 2006 - STAT3-dependent pathfinding and control of axonal branching and target selection
- Other Figures
- All Figure Page
- Back to All Figure Page
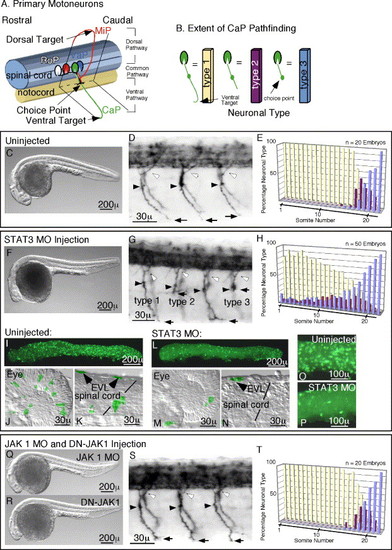
Morpholino (MO) Inactivation of STAT3, but not JAK1, causes Pathfinding defects. In panels D, G, and S, white arrowheads mark dorsal projections, black arrowheads the choice point, black arrows mark the most ventral extension of the CaP motoneuron axon. (A) Schematic diagram of primary motoneurons in the zebrafish showing motoneuron subtypes: RoP, MiP, CaP, and VaP, and their axon projections. (B) Schematic diagram of CaP neural types based upon extent of axon pathfinding used in quantitations shown in panels E, H, G, T, and in Fig. 2 and Fig. 3. (C–E) Analysis of uninjected embryos. (C) Whole body image of an uninjected embryo showing the normal body axis. (D) Normal primary motoneuron projections in an uninjected embryo. (E) Quantitation of CaP neural types in uninjected embryos, showing type 2 and 3 neurons confined to caudal somites. (F–H) Analysis of STAT3 MO injected embryos. (F) Whole body image of a STAT3 MO injected embryo showing foreshortened anterior axis with subsequent fore and mid-brain defects. These defects result from reduced anterior axial mesendoderm cell migration, a morphotype of STAT3 inactivation. (G) Primary motoneuron projections in a STAT3 MO injected embryo showing forestalled ventral CaP axon projections. (H) Quantitation of CaP neural types in STAT3 MO embryos showing stalled type 2 and 3 neurons in rostral as well as caudal somites. (I–P) Comparison of activated STAT3 in uninjected and STAT3 MO injected embryos. (I and L) Whole embryo images of phospho-STAT3 containing cells in uninjected (I) and STAT3 MO injected (L) embryos. (J and M) Images of the eye showing phospho-STAT3-positive cells in uninjected (J) and STAT3 MO injected (M) embryos. (K and N) Images of the spinal cord showing the presence of phospho-STAT3 containing neurons in uninjected (K) and STAT3 MO injected (N) embryos. (O and P) Close up of EVL cells expressing activated STAT3 in an uninjected embryo (O) and reduced cell numbers in a STAT3 MO injected embryo (P). (Q–T) Analysis of JAK1 MO injected and DN-JAK1 expressing embryos. (Q) Whole body image of a JAK1 MO injected embryo showing foreshortened anterior axis with subsequent fore and mid-brain defects. These defects result from reduced anterior axial mesendoderm cell migration, a morphotype indicative of JAK1 inactivation. (R) Whole body image of a DN-JAK1 expressing embryo showing anterior axis defects identical to that see in panel Q above. (S) Primary motoneuron projections in a JAK1 MO injected embryo, showing normal axonal trajectories. Pathfinding is also unaffected in DN-JAK1 expressing embryos. (T) Quantitation of CaP neural types in JAK1 MO injected embryos, showing type 2 and 3 neurons confined to caudal somites as is seen for uninjected embryos. Identical results were obtained for DN-JAK1 expressing embryos. In all images, rostral is to the left, and dorsal is up. |
| Gene: | |
|---|---|
| Fish: | |
| Knockdown Reagent: | |
| Anatomical Terms: | |
| Stage: | Prim-5 |
Reprinted from Developmental Biology, 296(1), Conway, G., STAT3-dependent pathfinding and control of axonal branching and target selection, 119-136, Copyright (2006) with permission from Elsevier. Full text @ Dev. Biol.