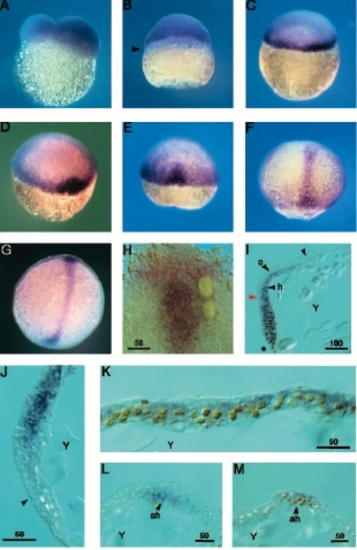
(A-G) TARAM-A RNA expression in early zebrafish embryos stages. Whole-mount view from lateral (A-C), or dorsal (D-G) side; (A-F) animal pole is to the top; (G,H) anterior is to the top. (A) 2-cell-stage. (B) 500-cell stage. TARAM-A expression is fading from the marginal cells corresponding to the prospective yolk syncitial layer cells (YSL) (arrowhead). (C) Dome stage. TARAM-A expression is no longer detected in animal pole cells and is restricted to the marginal zone. (D) 40% epiboly stage. An additional domain of TARAM-A appears on the future dorsal side. (E) Shield stage. The expression in the marginal zone is fading and the TARAM-A territory expression occupies the shield area. (F) 80% epiboly stage and (G,H) 100% epiboly stage; labelling is restricted to the embryonic axis. (H) Flat-mount view of head of an embryo at the end of gastrulation labelled with gsc (red) and TARAM-A (purple). The anterior limit of TARAM-A expression is bordered by the anterior, crescent-shaped gsc domain. (I-M) Sections of embryos labelled with a TARAM-A probe (blue) and an anti-NTL antibody (nucleus in yellowish brown). (I-K) Sagittal section; (L,M) cross sections. Y indicates the position of the yolk, the black arrowheads indicate the positions of the epiblast (e) and the hypoblast (h) or axial hypoblast (ah). (I) Sagittal section through a 70% epiboly stage embryo; the asterisk indicates the blastoderm margin, the red arrowhead indicates the anterior boundary of NTL protein distribution and the blue arrowhead the anterior boundary of TARAM-A expression in the hypoblast (dorsal to the left). Brachet’s cleft, delimiting the hypoblast-epiblast boundary, is visible in the anterior part of the embryo (Kimmel et al., 1995). (J,K) Sagittal section through the head (J), or the trunk (K), of a 95% epiboly stage embryo, (J, anterior down). The head can be divided into three regions. Anterior to the blue arrowhead, where the crescent-shaped expression of gsc is detected (see H), no TARAM-A expression is detected. Posterior to the blue arrowhead, both hypoblast and epiblast weakly express TARAM-A. More posteriorly, strong TARAM-A expression is graded, with peak levels around hypoblast-epiblast boundary. Periderm is not labelled. (K; anterior left) The axial hypoblast corresponding to the future notochord expresses specifically ntl and is labelled by TARAM-A. In addition to the hypoblast the epiblast is labelled. (L,M) Transverse sections through the head (L) and the trunk (M) of a 95% epiboly stage embryo. Staining is axial in both cases. Values for scale bars are indicated in μm.
|
