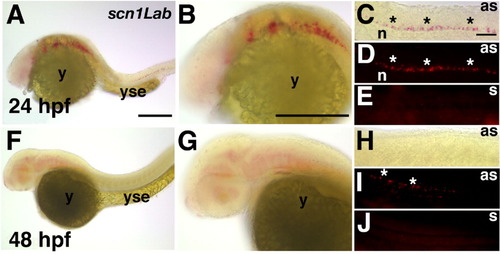
Scn1Lab expression is restricted to the central nervous system. A-E: At 24 hours postfertilization (hpf), scn1Lab transcripts are detected in ventral regions of the hindbrain and spinal cord. A: A low-magnification view reveals expression in the hindbrain and spinal cord. B: Scn1Lab expression is detected in ventral regions of the hindbrain. C: Similarly, in the spinal cord, scn1Lab expression is detected in ventral regions (asterisks). D: Epifluorescent illumination of the Fast Red in situ hybridization signal reveals expression ventrally within the spinal cord (asterisks). E: Using the same hybridization conditions as for antisense, the sense probe does not reveal a signal. F-J: At 48 hpf, scn1Lab expression is found diffusely within rostral regions of the central nervous system. F,G: Within the rostral central nervous system, scn1Lab expression is detected diffusely within ventral regions. H,I: Within the spinal cord, scn1Lab expression appears weaker at 48 versus 24 hpf because it is only detected by epifluorescent (I, asterisks) and not brightfield (H) illumination. J: The sense probe does not reveal a signal at 48 hpf, even using epifluorescent illumination. as, antisense probe; n, notochord; s, sense probe; y, yolk sac; yse, yolk sac extension. Scale bars = 250 μm in A (applies to A,F), 100 μm in B (applies to B,G), 100 μm in C (applies to C-E,H-J).
|
