
Fig. 6
- ID
- ZDB-FIG-051105-6
- Publication
- Rieger et al., 2005 - Quantum dots are powerful multipurpose vital labeling agents in zebrafish embryos
- Other Figures
- All Figure Page
- Back to All Figure Page
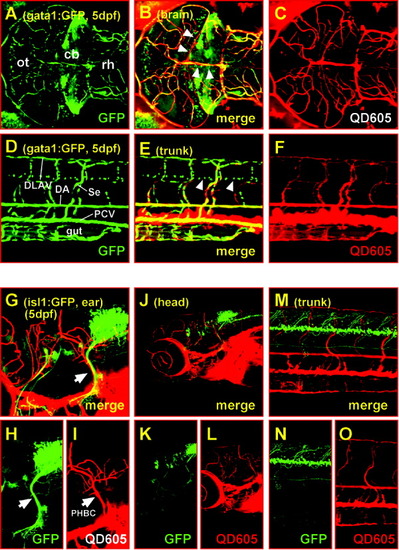
Combining green fluorescent protein (GFP) and quantum dot fluorescence in living specimens. A-C: Maximum intensity projection of 82 sections each 1.97 μm apart; dorsal views of the midbrain and anterior hindbrain of a 5-day-old homozygous gata1:GFP (strain 781) zebrafish larvae. Laser scanning confocal microscopy with excitation at 488 nm reveals both green fluorescent blood vessels and cell clusters in the brain due to GFP expression in erythrocytes and distinct neuronal populations (see also Movie 6 for their three-dimensional organization). C: The vasculature also displays an intense red fluorescence due to quantum dots carried along with the blood serum. B: Note that the signal from the neuronal clusters does not appear in the red channel and is not double stained in the merged image, indicating that there is no bleeding of the GFP fluorescence into the red channel. Thus, both fluorescent signals can be separated using conventional filter sets. D-F: In the lateral views of the trunk of the same specimen, all the characteristic blood vessels can be detected by both GFP (D) and quantum dot (F) fluorescence, demonstrating that both fluorophores can be efficiently separated when colocalized within the same structure (note the exclusively green signal of GFP-expressing cells in the ventral neural tube, white arrowheads in E). G-O: Projections of image stacks recorded by laser scanning confocal microscopy. Lateral views of heterozygous 5-day-old islet1:GFP zebrafish larvae after QD605 microangiography. The GFP-expressing vagus sensory ganglion (H, white arrow) and the primordial hindbrain channel (I, white arrow) appear to share a common trajectory (G, maximum intensity projection of 35 sections each 1.97 μm apart) also verified by three-dimensional re-sectioning. This coprojection does not appear to be characteristic for the majority of axon tracts (K) and blood vessels (L) in the brain (J, maximum intensity projection of 100 sections each 3.03 μm apart) and trunk (M-O, maximum intensity projection of 49 sections each 1.98 μm apart), respectively. cb, cerebellum; DA, dorsal aorta; DLAV, dorsal longitudinal anastomotic vessel; ot, optic tectum; PCV, posterior cardinal vein; PHBC, primordial hindbrain channel; rh, rhombencephalon; Se, intersegmental vessel; dpf, days postfertilization. |