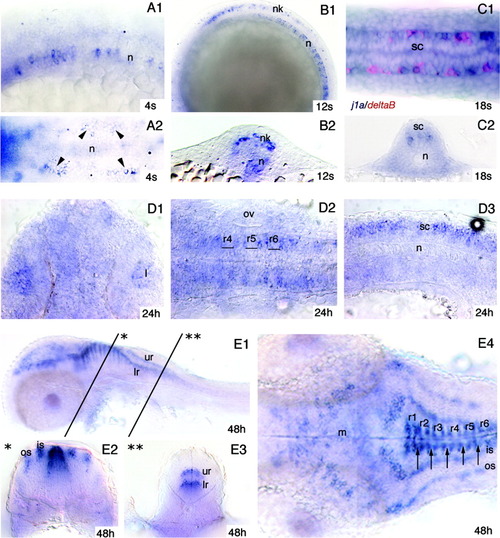
jagged1a expression pattern. in situ hybridization of embryos at different developmental stages performed with the jagged1a probe. A: At the four-somite stage (4s), jagged1a is expressed in the notochord (A1) and in scattered cells (arrowheads) in the intermediate neural plate (A2). B: At the 12-somite stage (B1, B2) jagged1a is expressed in the notochord and in cells located in the intermediate neural keel. C: At the 18-somite stage (C1, C2) the notochord is no longer labeled, while in the spinal cord jagged1a is expressed in cells located in a mediolateral position where some cells expressing deltaB are also observed (C1). D: At 24 hpf jagged1a is expressed in the lens (D1), the rhombomere borders (D2), and the spinal cord (D3). E: At 48 hpf in the central nervous system (E1-E4), jagged1a-expressing cells occur in the midbrain, hindbrain, and spinal cord. In the hindbrain (E1, E2, E4), the labeled cells are located dorsally at the anterior and posterior rhombomere borders and in bilateral inner and outer strings of cell clusters. In the caudal hindbrain and spinal cord (E1 and E3), the jagged1a-expressing cells are situated medially in bilateral upper and lower stripes. In D2 and E4, the position of the rhombomeres has been determined on the basis of the location of the otic vesicles. The arrows in E4 indicate the boundaries between the rhombomeres. Views are lateral (A1, B1, D3, E1) or dorsal (A2, C1, D1, D2, E4); transverse sections are the level of the trunk (B2, C2), the rhombomeres (E2), and caudal hindbrain (E3). Anterior is to the left in all lateral and dorsal views except for D1, in which it is to the top. is, inner string of jagged1a-expressing cell clusters; l, lens; lr, lower row of jagged1a-expressing cells; m, midbrain; n, notochord; nk, neural keel; os, outer string of jagged1a-expressing cell clusters; ov, otic vesicle; r1 to r6, rhombomeres 1 to 6; sc, spinal cord; ur, upper row of jagged1a-expressing cells.
|
