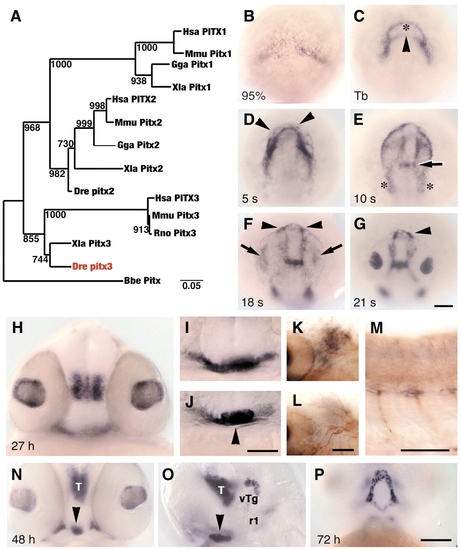
Zebrafish lens and pituitary cells express Pitx3. (A) Nearest-neighbor joining tree of full-length Pitx amino acid sequences. Zebrafish Pitx3 (red) groups with Xenopus and mammalian Pitx3 proteins. Bootstrap analysis: random number seed, 111; numbers on branches indicate the number of times each node was obtained in 1000 runs. Danio rerio (Dre, AF181681), Homo sapiens (Hsa, P78337, AF238048, AF041339), Mus musculus (Mmu, NM_011097, NM_011098, NM_008852), Rattus norvegicus (Rno, NM_019334, NM_019247), Gallus gallus (Gga, AF069397, AF076640), Xenopus laevis (Xla, AF217647, AF077767, AF297713) and Branchiostoma belcheri (Bbe, AF195616). (B-J) In wild-type embryos, pitx3 is expressed (black) at (B) 95% epiboly; (C) bud stage, in two domains that outline underlying polster (asterisk) and anterior neural plate border (arrowhead); (D) five-somite stage, in cells (arrowheads) around the anterior neural keel; (E) 10-somite stage, presumptive first branchial arch precursors (asterisks) and presumptive forebrain-midbrain border (arrow); (F,G) 18- and 21-somite stages, in prospective lens (arrows) and pituitary placodes (arrowheads); (H) 27 h, in lens and ventral posterior diencephalon; (I) 27 h, in ventral head mesenchyme; (J) 27 h, pituitary (arrowhead). (K-M) 27 h. Double labeling with mRNA probe for pitx3 (black) and anti-acetylated tubulin (brown) indicates that branchial arch mesenchyme (K), which is posterior to eye and ventral to trigeminal placode (L), and trunk muscle pioneer cells (M) express pitx3. (N-P) At 48-72 h, cells in pituitary (arrowheads), thalamus (T), ventral tegmentum (vTg), first rhombomere (r1) and Meckel′s cartilage (P) express pitx3. (B-G) Dorsal view of prospective head region, ventral towards the top; (H-J,N) frontal view, dorsal upwards; (K,L) dorsal view, anterior towards left, different focal planes of same region; (M,O) side view, anterior towards left and dorsal towards top; (P) ventral view, anterior towards top. Scale bars: 100 µm in B-G,H-J,N-P; 50 µm in K-M.
|
