
- Title
-
A cardiovascular, craniofacial, and neurodevelopmental disorder caused by loss-of-function variants in the eIF3 complex component genes EIF3A and EIF3B
- Authors
- Erkut, E., Somerville, C., Schwartz, M.L.B., McDonald, L., Ding, Q., Moran, O.M., Chen, X., Manshaei, R., Riedijk, A.S., Schnürer, M.T., Koboldt, D.C., Antonarakis, S.E., Bedoukian, E.C., Blanc, X., Conlin, L.K., Cox, H., Diderich, K.E.M., Dingmann, B., Dubourg, C., Elmslie, F., Escobar, L.F., Gosselin, R., Guillen Sacoto, M.J., Haag, C.D., Herzig, L., Jeeneea, R., Kenia, P., Kolokotronis, K., Kopps, A.M., Kupper, C., Lees, H., Leonard, J., Levy, J., Littlejohn, R., Mayer, D., McLean, S.D., Pattani, N., Perrin, L., Pingault, V., Quelin, C., Ranza, E., Rauch, A., Reichert, S.L., Rosmaninho-Salgado, J., Skraban, C., Sousa, S., Stuebben, M., Zanoni, P., Kim, R.H., Scott, I.C., Jobling, R.K.
- Source
- Full text @ Am. J. Hum. Genet.
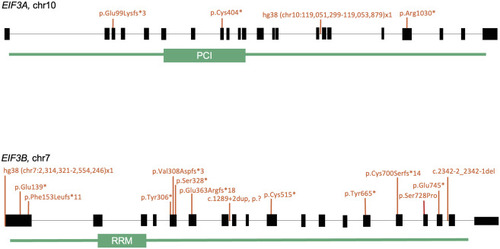
Schematic of EIF3A and EIF3B domains, highlighting the proteasome component domain in EIF3A, and the RNA recognition motif in EIF3B Variants identified in the human cohort are shown in orange. The EIF3B full-gene deletion, hg38 (chr7:2314321–2554246)x1 also encompasses exon 1 of SNX8, CHST12, GRIFIN, LFNG, and several exons in the 3ʹ end of BRAT1. |
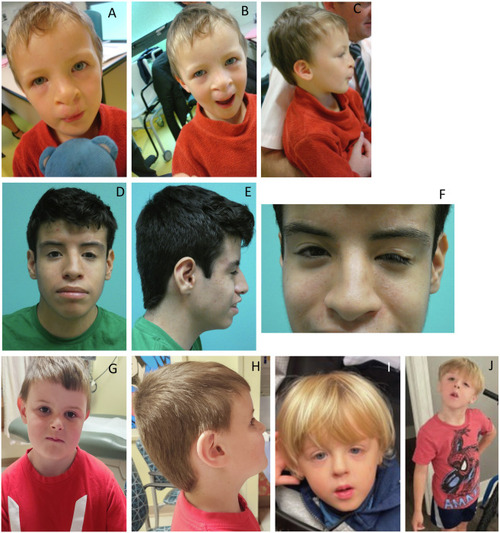
Photographs of probands with de novo variants in EIF3B or EIF3A (A–C) Clinical images of proband #4, with a canonical acceptor splice site variant in EIF3B; (D–F) proband #9 with a loss-of-function variant in EIF3B; (G–H) proband #15, with a loss-of-function variant EIF3A; and (I and J) proband #18, with a loss-of-function variant in EIF3A. |
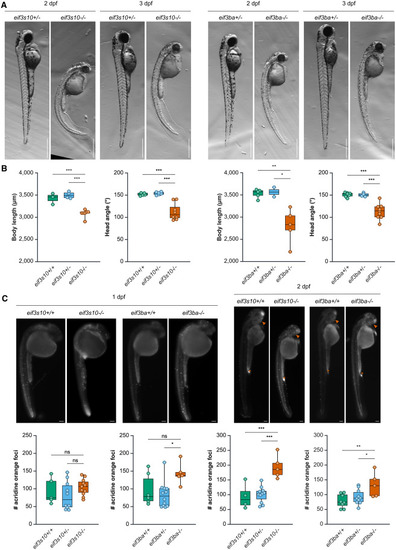
Loss of eif3a and eif3b in zebrafish causes a spectrum of defects similar to those observed in affected individuals (A) Bright-field images of eif3s10−/− and eif3ba−/− embryos compared to heterozygous siblings at 2 and 3 dpf. Scale bars: 500 μm. Mutant embryos exhibit reduced size, delayed pigmentation, trunk curvature, and pericardial edema. (B) Body length is significantly reduced at 3 dpf for both eif3s10−/− and eif3ba−/− mutant embryos. Additionally, head angle is significantly reduced at 3 dpf, indicative of a growth delay. Significance was determined by one-way ANOVA with Tukey multiple comparisons test; ∗p ≤ 0.05, ∗∗p ≤ 0.01, and ∗∗∗p ≤ 0.001. Each data point is one embryo, body length n = 2–7, and head angle n = 4–9. (C) Acridine orange staining for apoptotic cells indicates a slight increase in apoptosis for eif3ba−/− embryos at 1 dpf, while there is no change for eif3s10−/− embryos. At 2 dpf, there is a significant increase in apoptosis for both eif3s10−/− and eif3ba−/− embryos when compared to their heterozygous or WT siblings. The orange asterisk (anal opening) and orange arrowhead (retina) indicate regions that have high levels of apoptosis during normal development; therefore, a high concentration of acridine orange is expected even in WT embryos. Significance was determined by one-way ANOVA with Tukey multiple comparisons test; ∗p ≤ 0.05, ∗∗p ≤ 0.01, and ∗∗∗p ≤ 0.001. Scale bars: 100 μm. Each data point is one embryo, 1 dpf n = 5–12 embryos, and 2 dpf n = 5–11 embryos. |
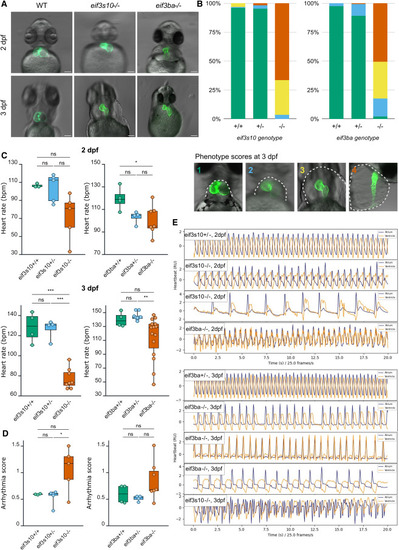
eif3s10 and eif3ba loss-of-function mutants exhibit underdeveloped hearts and significantly impaired cardiac function (A) At 2 dpf, homozygous mutants have stretched out hearts compared to WT. This worsens by 3 dpf, with hypoplastic heart tubes and severe pericardial edema. Scale bars: 100 μm. (B) A greater proportion of homozygous mutants show “severe”-looking hearts at 3 dpf compared to heterozygous or WT siblings from the same clutch. Categories: 1 = WT-like, fully looped heart, no pericardial edema; 2 = heart is mostly looped, small pericardial edema; 3 = little to no looping, heart is stretched out, small chambers, large pericardial edema; and 4 = thin heart tube with no clear chambers or looping, severe pericardial edema that extends beyond the yolk (note: this image is lateral, the others are ventral). The gray dashed line in example images indicates the edge of pericardial edema. 3 clutches were scored per gene. eif3s10 n = 133, 71, and 99 embryos. eif3ba n = 88, 169, and 112 embryos. Proportions of each phenotypic category per genotype were averaged prior to plotting. (C) Mutant heart rate (beats per minute [bpm]), measured via PyHeart4Fish video analysis, was reduced compared to heterozygous and WT siblings. Significance was determined by one-way ANOVA with Tukey multiple comparisons test; ∗p ≤ 0.05, ∗∗p ≤ 0.01, and ∗∗∗p ≤ 0.001. Each data point is one embryo, and n = 3–15 embryos. (D) Arrhythmia score at 2 dpf, measured by PyHeart4Fish, reveals irregular heartbeats in eif3s10 and eif3ba mutants. A lower score indicates more regular heartbeats, with 0.7 considered the cutoff for arrhythmia. Significance was determined by one-way ANOVA with Tukey multiple comparisons test; ∗p ≤ 0.05. Each data point is one embryo, and n = 3–7 embryos. (E) Sample heartbeat traces at 2 and 3 dpf (measured by PyHeart4Fish) demonstrate irregular heartbeats for mutants vs. heterozygotes (top). Blue lines indicate atrial beats, while orange lines indicate ventricular beats. |
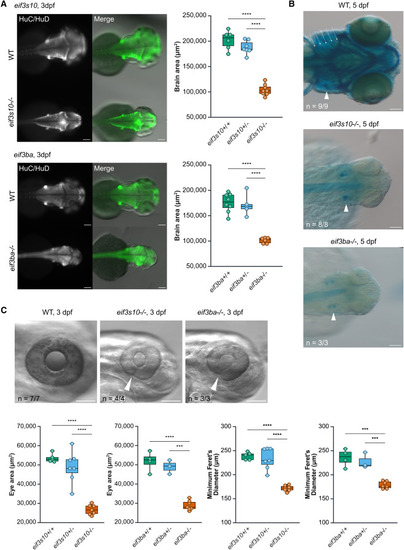
eif3s10 and eif3ba loss-of-function mutants exhibit extracardiac abnormalities including reduced brain size, coloboma, reduced eye size, and craniofacial cartilage defects (A) Immunofluorescent staining for a pan-neuronal marker (HuC/HuD) reveals reduced brain size in mutants compared to WT siblings at 3 dpf. Quantification revealed a significant decrease in brain area for both eif3s10 and eif3ba mutants. Significance was determined by one-way ANOVA with Tukey multiple comparisons test; ∗p ≤ 0.05, ∗∗p ≤ 0.01, ∗∗∗p ≤ 0.001, and ∗∗∗∗p ≤ 0.0001. Each data point is one embryo, and n = 5–8 embryos. All scale bars: 100 μm. (B) Dorsal view of Alcian blue-stained embryos reveals a lack of facial cartilage (including jaw and pharyngeal arches) in mutant embryos compared to WT at 5 dpf. White arrowheads indicate otic vesicles, and white arrows indicate pharyngeal arches. All scale bars: 100 μm. (C) Mutant embryos have small eyes and coloboma at 3 dpf, with white arrowheads marking incomplete closure of the optic fissure. Quantification revealed a significant decrease in eye area and minimum Feret's diameter. All scale bars: 100 μm. Significance was determined by one-way ANOVA with Tukey multiple comparisons test; ∗p ≤ 0.05, ∗∗p ≤ 0.01, ∗∗∗p ≤ 0.001, and ∗∗∗∗p ≤ 0.0001. Each data point is one embryo (right eye measured only), and n = 3–7 embryos. |