
Fig. 3
- ID
- ZDB-FIG-251117-13
- Publication
- Erkut et al., 2025 - A cardiovascular, craniofacial, and neurodevelopmental disorder caused by loss-of-function variants in the eIF3 complex component genes EIF3A and EIF3B
- Other Figures
- All Figure Page
- Back to All Figure Page
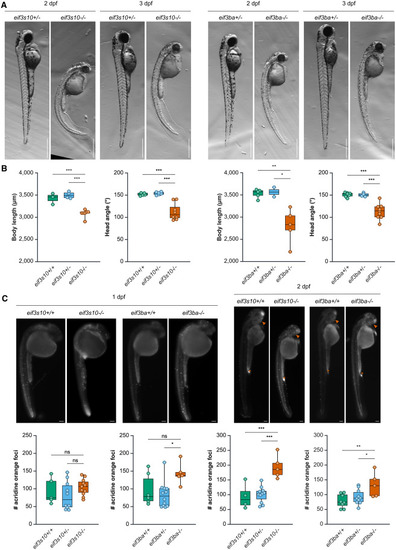
Loss of eif3a and eif3b in zebrafish causes a spectrum of defects similar to those observed in affected individuals (A) Bright-field images of eif3s10−/− and eif3ba−/− embryos compared to heterozygous siblings at 2 and 3 dpf. Scale bars: 500 μm. Mutant embryos exhibit reduced size, delayed pigmentation, trunk curvature, and pericardial edema. (B) Body length is significantly reduced at 3 dpf for both eif3s10−/− and eif3ba−/− mutant embryos. Additionally, head angle is significantly reduced at 3 dpf, indicative of a growth delay. Significance was determined by one-way ANOVA with Tukey multiple comparisons test; ∗p ≤ 0.05, ∗∗p ≤ 0.01, and ∗∗∗p ≤ 0.001. Each data point is one embryo, body length n = 2–7, and head angle n = 4–9. (C) Acridine orange staining for apoptotic cells indicates a slight increase in apoptosis for eif3ba−/− embryos at 1 dpf, while there is no change for eif3s10−/− embryos. At 2 dpf, there is a significant increase in apoptosis for both eif3s10−/− and eif3ba−/− embryos when compared to their heterozygous or WT siblings. The orange asterisk (anal opening) and orange arrowhead (retina) indicate regions that have high levels of apoptosis during normal development; therefore, a high concentration of acridine orange is expected even in WT embryos. Significance was determined by one-way ANOVA with Tukey multiple comparisons test; ∗p ≤ 0.05, ∗∗p ≤ 0.01, and ∗∗∗p ≤ 0.001. Scale bars: 100 μm. Each data point is one embryo, 1 dpf n = 5–12 embryos, and 2 dpf n = 5–11 embryos. |