
Fig. 4
- ID
- ZDB-FIG-251117-14
- Publication
- Erkut et al., 2025 - A cardiovascular, craniofacial, and neurodevelopmental disorder caused by loss-of-function variants in the eIF3 complex component genes EIF3A and EIF3B
- Other Figures
- All Figure Page
- Back to All Figure Page
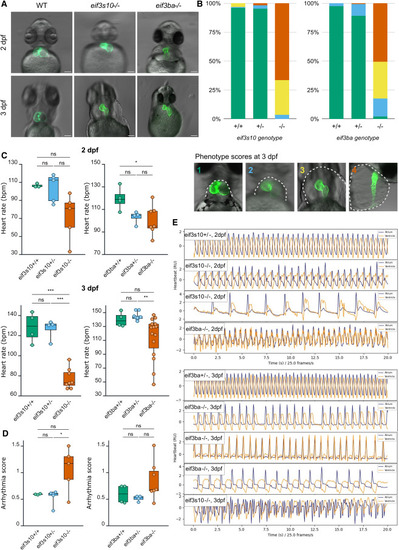
eif3s10 and eif3ba loss-of-function mutants exhibit underdeveloped hearts and significantly impaired cardiac function (A) At 2 dpf, homozygous mutants have stretched out hearts compared to WT. This worsens by 3 dpf, with hypoplastic heart tubes and severe pericardial edema. Scale bars: 100 μm. (B) A greater proportion of homozygous mutants show “severe”-looking hearts at 3 dpf compared to heterozygous or WT siblings from the same clutch. Categories: 1 = WT-like, fully looped heart, no pericardial edema; 2 = heart is mostly looped, small pericardial edema; 3 = little to no looping, heart is stretched out, small chambers, large pericardial edema; and 4 = thin heart tube with no clear chambers or looping, severe pericardial edema that extends beyond the yolk (note: this image is lateral, the others are ventral). The gray dashed line in example images indicates the edge of pericardial edema. 3 clutches were scored per gene. eif3s10 n = 133, 71, and 99 embryos. eif3ba n = 88, 169, and 112 embryos. Proportions of each phenotypic category per genotype were averaged prior to plotting. (C) Mutant heart rate (beats per minute [bpm]), measured via PyHeart4Fish video analysis, was reduced compared to heterozygous and WT siblings. Significance was determined by one-way ANOVA with Tukey multiple comparisons test; ∗p ≤ 0.05, ∗∗p ≤ 0.01, and ∗∗∗p ≤ 0.001. Each data point is one embryo, and n = 3–15 embryos. (D) Arrhythmia score at 2 dpf, measured by PyHeart4Fish, reveals irregular heartbeats in eif3s10 and eif3ba mutants. A lower score indicates more regular heartbeats, with 0.7 considered the cutoff for arrhythmia. Significance was determined by one-way ANOVA with Tukey multiple comparisons test; ∗p ≤ 0.05. Each data point is one embryo, and n = 3–7 embryos. (E) Sample heartbeat traces at 2 and 3 dpf (measured by PyHeart4Fish) demonstrate irregular heartbeats for mutants vs. heterozygotes (top). Blue lines indicate atrial beats, while orange lines indicate ventricular beats. |