
|
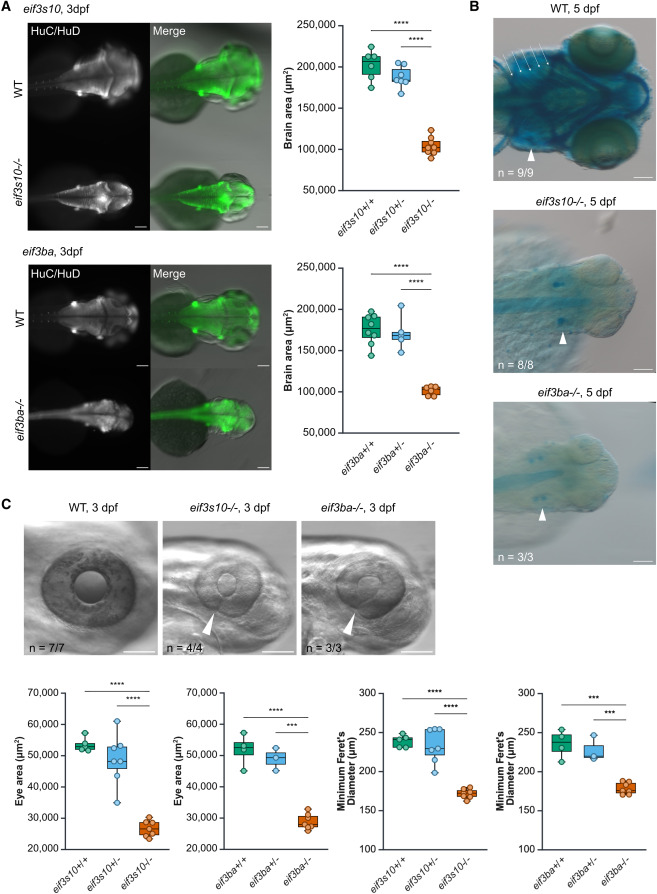
Fig. 5 eif3s10 and eif3ba loss-of-function mutants exhibit extracardiac abnormalities including reduced brain size, coloboma, reduced eye size, and craniofacial cartilage defects (A) Immunofluorescent staining for a pan-neuronal marker (HuC/HuD) reveals reduced brain size in mutants compared to WT siblings at 3 dpf. Quantification revealed a significant decrease in brain area for both eif3s10 and eif3ba mutants. Significance was determined by one-way ANOVA with Tukey multiple comparisons test; ∗p ≤ 0.05, ∗∗p ≤ 0.01, ∗∗∗p ≤ 0.001, and ∗∗∗∗p ≤ 0.0001. Each data point is one embryo, and n = 5–8 embryos. All scale bars: 100 μm. (B) Dorsal view of Alcian blue-stained embryos reveals a lack of facial cartilage (including jaw and pharyngeal arches) in mutant embryos compared to WT at 5 dpf. White arrowheads indicate otic vesicles, and white arrows indicate pharyngeal arches. All scale bars: 100 μm. (C) Mutant embryos have small eyes and coloboma at 3 dpf, with white arrowheads marking incomplete closure of the optic fissure. Quantification revealed a significant decrease in eye area and minimum Feret's diameter. All scale bars: 100 μm. Significance was determined by one-way ANOVA with Tukey multiple comparisons test; ∗p ≤ 0.05, ∗∗p ≤ 0.01, ∗∗∗p ≤ 0.001, and ∗∗∗∗p ≤ 0.0001. Each data point is one embryo (right eye measured only), and n = 3–7 embryos.