
- Title
-
Altered motor activity and social behavior in zebrafish lacking the Hcn2b ion channel
- Authors
- Rodríguez-Ortiz, R., Fernández-Rosales, J.P., García-Peña, M.F., Hernández, A., Espino-Saldaña, A.E., Martínez-Torres, A.
- Source
- Full text @ Neuroscience
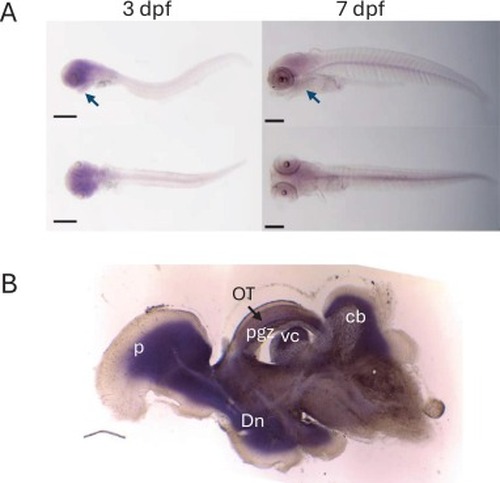
Distribution of hcn2b mRNA. A. hcn2b was detected in the whole brain retina and heart (arrow) at 3 dpf, this distribution is maintained at 7 dpf. B. Adult distribution of hcn2b mRNA includes the pallium (p), the optic tectum (OT), the periventricular gray zone of optic tectum (pgz), the valvula cerebelli (vc), the cerebellum (Cb) and the diffuse nucleus of the inferior lobe (Dn). EXPRESSION / LABELING:
|
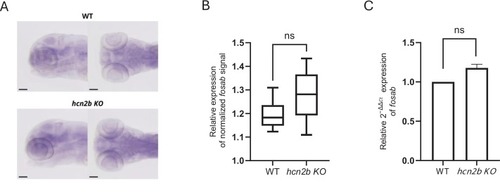
Analysis of fosab expression. A. Whole-mount in situ hybridization of fosab in WT and hcn2b KO larvae shows uniform expression throughout the brain. No region-specific differences were observed. Scale bar: 100 μm. B. Quantification of normalized signal intensity of WISH (n = 7 larvae per group) revealed no significant difference between WT and hcn2b KO (unpaired t-test, p > 0.05). C. RT-qPCR analysis of fosab expression using the ΔΔCt method (n = 4 biological replicates per group) showed a non-significant trend toward increased expression in hcn2b KO mutants compared to WT (unpaired t-test, p > 0.05). EXPRESSION / LABELING:
|
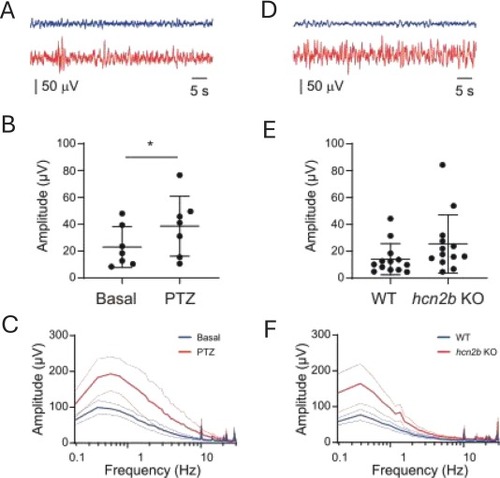
Electrophysiological activity from extracellular recordings. A and D. Representative traces showing electrical activity components from 0.5 to 8 Hz, control or basal activity is shown in blue and PTZ and hcn2b mutants activity is shown in red. B. Average amplitude taken from 2 to 4 Hz spectra indicates the mean, standard deviation and individual subjects, shows a significant increase in PTZ (*p < 0.05, Wilcoxon's t-test, n = 7). C. Summary amplitude distribution along the frequency spectra in basal (blue) and PTZ (red), thin lines show the S.E.M. E. Average amplitude taken from 2 to 4 Hz spectra indicates the mean, standard deviation and individual subjects show a trend to increase in the amplitude without a significant change on hcn2b KO compared to the control group. F. Summary amplitude distribution along the frequency spectra in control group (blue) and hcn2b KO (red), thin lines show the S.E.M. PHENOTYPE:
|
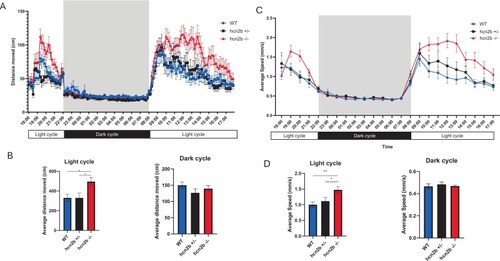
hcn2b KO is more active during the light hours of the day. A. 24 h locomotor activity of larvae (7 dpf). B. Statistically significant differences were observed in the locomotor activity of hcn2b mutants during the light-cycle but not in the dark-cycle. Data expressed as the means ± SEM and analyzed by Kruskal–Wallis n = 27, p < 0.05 (*). C. Average swimming speed during a 24 h cycle. D. Consistent with differences in traveling distance, in average hcn2b KO swam faster during the light cycle. Data expressed as the means ± SEM and analyzed by Kruskal–Wallis n = 27, p < 0.05 (*), p < 0.01 (**). PHENOTYPE:
|
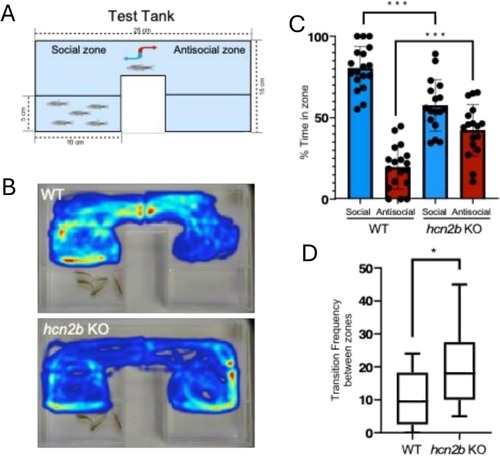
Altered social activity in hcn2b KO. A. Scheme of the experimental test tank. A U-shape test tank was designed to evaluate the social interaction in WT and hcn2b KO. In the social zone the U-arm included five fish from the same tank as the evaluated fish while the antisocial zone arm was empty. B. Sample 10 min tracking of a single fish (WT or hcn2b KO) in the test tank. C. Percentage of time spent by tested fish in social (blue) and antisocial (red) zones during a 10-minute assay. D. Transition frequency between zones. The number of times the fish crossed the center of the tank between social and antisocial zones. WT n = 18, hcn2b KO = 17. Unpaired t test in B (P value > 0.001) and in C (P value 0.012). PHENOTYPE:
|