
Fig. 3
- ID
- ZDB-IMAGE-251022-3
- Publication
- Rodríguez-Ortiz et al., 2025 - Altered motor activity and social behavior in zebrafish lacking the Hcn2b ion channel
- All Figures
- Figures for Rodríguez-Ortiz et al., 2025
|
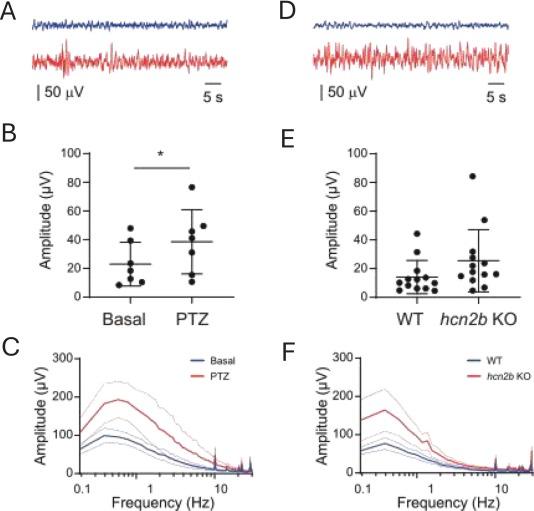
Fig. 3 Electrophysiological activity from extracellular recordings. A and D. Representative traces showing electrical activity components from 0.5 to 8 Hz, control or basal activity is shown in blue and PTZ and hcn2b mutants activity is shown in red. B. Average amplitude taken from 2 to 4 Hz spectra indicates the mean, standard deviation and individual subjects, shows a significant increase in PTZ (*p < 0.05, Wilcoxon's t-test, n = 7). C. Summary amplitude distribution along the frequency spectra in basal (blue) and PTZ (red), thin lines show the S.E.M. E. Average amplitude taken from 2 to 4 Hz spectra indicates the mean, standard deviation and individual subjects show a trend to increase in the amplitude without a significant change on hcn2b KO compared to the control group. F. Summary amplitude distribution along the frequency spectra in control group (blue) and hcn2b KO (red), thin lines show the S.E.M.