
Fig. 5
- ID
- ZDB-IMAGE-251022-5
- Publication
- Rodríguez-Ortiz et al., 2025 - Altered motor activity and social behavior in zebrafish lacking the Hcn2b ion channel
- All Figures
- Figures for Rodríguez-Ortiz et al., 2025
|
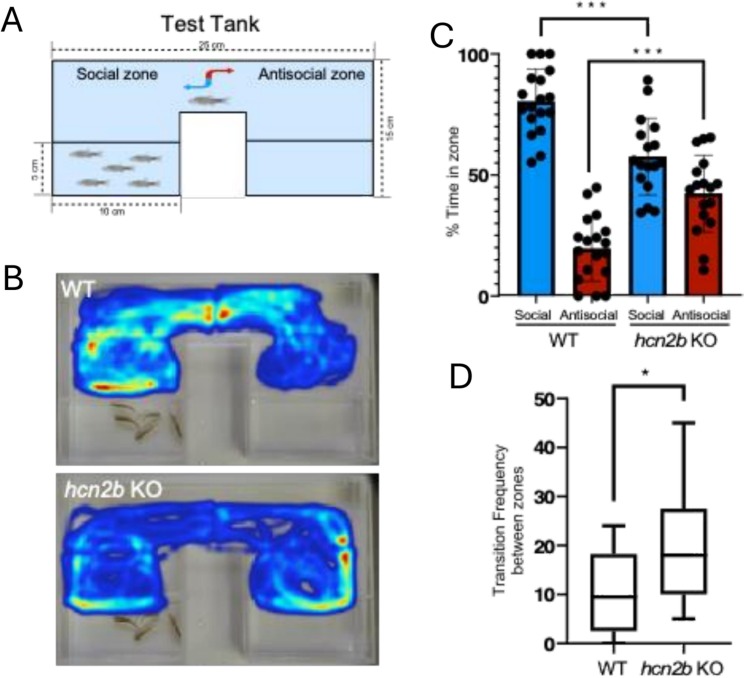
Fig. 5 Altered social activity in hcn2b KO. A. Scheme of the experimental test tank. A U-shape test tank was designed to evaluate the social interaction in WT and hcn2b KO. In the social zone the U-arm included five fish from the same tank as the evaluated fish while the antisocial zone arm was empty. B. Sample 10 min tracking of a single fish (WT or hcn2b KO) in the test tank. C. Percentage of time spent by tested fish in social (blue) and antisocial (red) zones during a 10-minute assay. D. Transition frequency between zones. The number of times the fish crossed the center of the tank between social and antisocial zones. WT n = 18, hcn2b KO = 17. Unpaired t test in B (P value > 0.001) and in C (P value 0.012).