
Fig. 2
- ID
- ZDB-IMAGE-251022-2
- Genes
- Publication
- Rodríguez-Ortiz et al., 2025 - Altered motor activity and social behavior in zebrafish lacking the Hcn2b ion channel
- All Figures
- Figures for Rodríguez-Ortiz et al., 2025
|
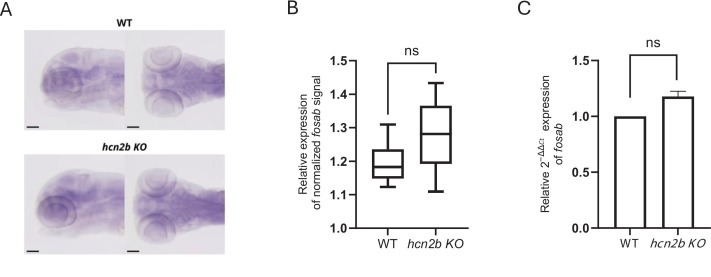
Fig. 2 Analysis of fosab expression. A. Whole-mount in situ hybridization of fosab in WT and hcn2b KO larvae shows uniform expression throughout the brain. No region-specific differences were observed. Scale bar: 100 μm. B. Quantification of normalized signal intensity of WISH (n = 7 larvae per group) revealed no significant difference between WT and hcn2b KO (unpaired t-test, p > 0.05). C. RT-qPCR analysis of fosab expression using the ΔΔCt method (n = 4 biological replicates per group) showed a non-significant trend toward increased expression in hcn2b KO mutants compared to WT (unpaired t-test, p > 0.05).