
- Title
-
Pathogenic variants in TMEM184B cause a neurodevelopmental syndrome associated with alteration of metabolic signaling
- Authors
- Chapman, K.A., Ullah, F., Yahiku, Z.A., Khan, S., Kodiparthi, S.V., Kellaris, G., White, H.G., Powell, A.T., Correia, S.P., Stödberg, T., Sofocleous, C., Marinakis, N.M., Fryssira, H., Tsoutsou, E., Traeger-Synodinos, J., Accogli, A., Sciruicchio, V., Salpietro, V., Striano, P., Muss, C., Keren, B., Heron, D., Berger, S.I., Pond, K.W., Sirimulla, S., Davis, E.E., Bhattacharya, M.R.C.
- Source
- Full text @ Am. J. Hum. Genet.

Brain MRI shows corpus callosum hypoplasia in two affected individuals with TMEM184B variants (A) Sagittal plane of spoiled gradient recalled acquisition (SPGR) magnetic resonance imaging (MRI) in an individual of the same age as individual 5 (family 5-II-1) who has an unrelated pathogenic variant (ZEB2) and shows no alterations in corpus callosum thickness. (B) Sagittal T2 MRI in individual 4 (family 4-II-1; p.Lys184Glu) shows corpus callosum disruption. (C) Sagittal SPGR MRI in individual 5 (family 5-II-1; c.787+1G>A) shows corpus callosum hypoplasia. |

Structural modeling and free energy of TMEM184B variants indicates significant disruptions to protein stability (A) Structure of the human TMEM184B transcript (GenBank: NM_012264.5). Blue and gray blocks show alternating exons of the spliced mRNA. Red arrow indicates the coding region of isoform a (GenBank: NP_036396.2). Areas predicted to be included in transmembrane helices (green) and locations of human variants (black) are noted. (B) Ramachandran plot showing that the structure predicted by FoldX analysis shows only allowable angles, providing confidence in the structure predicted. (C) Predicted local-distance difference test (pLDDT) scores per position across the whole protein sequence. Higher scores indicate higher confidence structural predictions in that region of the protein. (D) Native protein structure prediction by FoldX. Transmembrane helices are separately colorized. (E) p.Val88Met variant protein (magenta) overlaid onto the native TMEM184B structure (cyan). (F) p.Lys184Glu variant protein (green) overlaid onto the native TMEM184B structure (cyan). (G) Stability analysis calculations using Gibbs free energy. ΔΔG values that are positive indicate decreased protein stability of variant-containing TMEM184B when compared to the predicted native structure, while negative values indicate abnormally heightened protein structural stability. (H) Amino acid context for the p.Val88Met and p.Lys184Glu variants, both of which are conserved from yeast (Saccharomyces cerevisiae Hfl1) to humans. All other variants are conserved from Drosophila (Tmep) to human but are not found in yeast. |

Ectopic expression of TMEM184B variants p.Gly162Arg or p.Lys184Glu induces head-size and body-length phenotypes in zebrafish larvae (A) Representative bright-field lateral images of 3-day post-fertilization (dpf) larvae injected with 200 pg human TMEM184B mRNA (WT, p.Val88Met, p.Leu127Arg, p.Gly162Arg, p.Lys184Glu, p.Gly288Ala, and p.Arg282His). p.Arg282His is a presumed benign negative control (dbSNP: rs370107940; 215 heterozygotes and four homozygotes are present in 1,609,748 individuals in gnomAD v.4.1.0). Scale bar, 300 μm. Head area was measured according to white dashed line; body length was measured according to the red dashed line. (B and C) Quantification of the (B) lateral head size and (C) body length in 3-dpf larvae; n = 35–87/condition. (D) Representative bright-field lateral images of 4-dpf larvae injected with 200 pg human TMEM184B mRNA (WT, p.Gly162Arg, p.Lys184Glu, and p.Arg282His). Scale bar, 300 μm. (E and F) Quantification of the (E) lateral head size and (F) body length in 4-dpf larvae. Data shown are combined from two biological replicates; n = 54–71/condition. For (B), (C), (E), and (F), statistical differences were calculated using one-way ANOVA with Tukey’s post hoc test: ∗∗∗p < 0.001; ∗∗∗∗p < 0.0001; ns, not significant. Experimental conditions were normalized and presented as a percentage of the control mean. Error bars represent standard deviation of the mean. Data point color: black, uninjected control; blue, WT mRNA; red, variant mRNA identified in affected individuals; green, presumed benign variant mRNA from gnomAD. |

Loss of tmem184ba results in neuroanatomical defects, and in vivo complementation shows that some disease-associated variants result in loss of function (A) Representative bright-field lateral images of 3-dpf larvae injected with MO alone or co-injected with human TMEM184B mRNA (WT, p.Val88Met, p.Leu127Arg, p.Gly162Arg, p.Lys184Glu, p.Gly288Ala, and p.Arg282His). p.Arg282His is a presumed benign negative control (dbSNP: rs370107940; 215 heterozygotes and four homozygotes are present in 1,609,748 individuals in gnomAD v.4.1.0). Scale bar, 300 μm. (B and C) Quantification of the (B) lateral head size and (C) body length in 3-dpf larvae as indicated with anatomical landmarks in Figure 3A. Experimental conditions were normalized and presented as a percentage of the control mean. n = 50–88/condition. (D) Representative dorsal images of 3-dpf larval heads immunostained with acetylated tubulin. White dotted shape, optic tecta; white dotted line, midline between optic tecta where intertectal commissural axons were counted. Zoomed image at right of each panel corresponds to white box around both optic tecta. Anterior, left; posterior, right; Scale bar, 50 μm. (E) Quantification of optic tecta size as shown in (D). (F) Quantification of intertectal neurons that cross the dorsal midline as shown in (D). For (E) and (F), n = 30–47/condition. For (B), (C), (E), and (F), statistical analyses were performed with a one-way ANOVA with Tukey’s post-hoc test: ∗∗∗∗p < 0.0001; ∗∗∗p < 0.001; ∗∗p < 0.01; ns, not significant. Error bars represent standard deviation of the mean. Data point color: black, uninjected control; blue, WT mRNA; red, variant mRNA identified in affected individuals; green, presumed benign variant mRNA from gnomAD. EXPRESSION / LABELING:
PHENOTYPE:
|
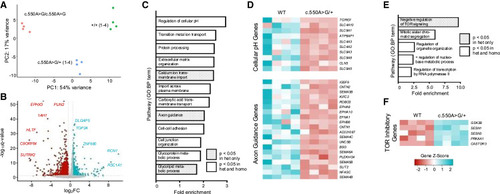
Transcriptomic analysis of variant-containing human iPSCs reveals alterations in neurodevelopmental pathways and endolysosomal function (A) Principal-component analysis (PCA) plot of RNA-seq data generated using DESeq2. Data were derived from induced pluripotent stem cell (iPSC) lines representing three groups (n = 4 biological replicates per group): wild type (WT), TMEM184Bc.550A>G/+, and TMEM184Bc.550A>G/c.550A>G. (B) Volcano plot illustrating the differential expression analysis results for TMEM184Bc.550A>G/+. Genes meeting the significance threshold (p < 0.05) and fold-change criteria (log2FC > 0.585 for upregulated genes [= FC > 1.5], log2FC < −0.415 for downregulated genes [= FC < 0.75]) are highlighted in teal (upregulated) and red (downregulated), respectively. (C) Downregulated GO biological processes (slim) (>1.5× enriched) in TMEM184Bc.550A>G/+. (D) Genes in two processes of likely relevance (regulation of cell pH and axon guidance) are plotted in respective Z-score normalized heatmaps. (E) Upregulated GO biological processes (slim) (>1.5× enriched) in TMEM184Bc.550A>G/+. (F) Heatmap of genes within one process of likely relevance (negative regulation of TOR signaling), scaled identically to (D). het, heterozygous; homo, homozygous; (+), WT allele. |

TMEM184B variants affect protein levels and cell viability (A) Cumulative distribution function of cells expressing WT and TMEM184B variants tagged with miRFP670. (B) Histogram of the fluorescent levels of individual cells expressing p.Lys184Glu tagged with miRFP670 were grouped into 256 bins and normalized to the percentage-mode protein level of each population. (C) Average raw fluorescence of TMEM184B variants compared to WT (3 trials, n = ∼20,000 cells per trial). Error bars represent SD. (D) FACS plots of HEK293T cells overexpressing native TMEM184B (left) or p.Lys184Glu variant (right) and grown in complete media. White numbers on the plots indicate the percentage of dead cells among untransfected (upper left) or TMEM184B-transfected HEK293T cells (upper right). (E) Percentage of dead TMEM184B variant-expressing cells normalized to WT levels (dashed line). 3 trials, n = ∼20,000 cells per trial. Error bars represent SD. ∗∗∗∗p < 0.0001. |
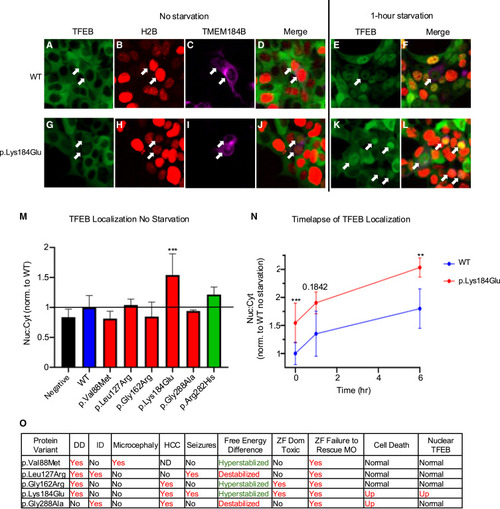
TFEB nuclear-to-cytoplasmic ratio is dominantly altered by expression of TMEM184B variants identified in affected individuals (A–D) Multichannel images of unstarved HEK293T cells overexpressing WT TMEM184B. Shown are (A) TFEB-GFP (green), (B) H2B-mRuby (red), and (C) TMEM184B-miRFP670 (magenta). (D) is a merged image. (E and F) HEK293T cells expressing WT TMEM184B and starved for 1 h. Shown are (E) TFEB-GFP and (F) merge (includes H2B:mRuby and MEM184B-miRFP670). Arrows in all images point to TMEM184B-miRFP670 transfected cells. All H2B-mRuby images had their lookup tables adjusted to 4,000 for visual clarity. (G–J) Multichannel images of unstarved HEK293T cells overexpressing TMEM184B p.Lys184Glu variant. Panels match those of the WT in (A)–(D). (K and L) TMEM184B-miRFP670 transfected cells starved for 1 h. TFEB-GFP and a merged image (TFEB-GFP, H2B:mRuby, and TMEM184B-miRFP670) are shown. (M) Ratio of mean TFEB-GFP fluorescence in the nucleus vs. cytoplasm in TMEM184B-miRFP670 expressing cells, normalized to WT cells. (N) Time course of TFEB nuclear/cytoplasmic localization of WT- and p.Lys184Glu-expressing cells over 6 h of starvation (N = 3 trials). Error bars in (M) and (N) represent SD. ∗∗∗p < 0.001, ∗∗p < 0.01. Fifty cells were quantified per trial, variant, and time point except for p.Lys184Glu at 6-h starvation (42–50 cells). (O) Summary table displaying the clinical, free energy, zebrafish, and cell assay results of each case-associated variant. Red text denotes differences from the WT condition. In the “free energy difference” column, red text indicates destabilization, and green text indicates hyperstabilization. |

ZFIN is incorporating published figure images and captions as part of an ongoing project. Figures from some publications have not yet been curated, or are not available for display because of copyright restrictions. PHENOTYPE:
|
|
ZFIN is incorporating published figure images and captions as part of an ongoing project. Figures from some publications have not yet been curated, or are not available for display because of copyright restrictions. PHENOTYPE:
|