
|
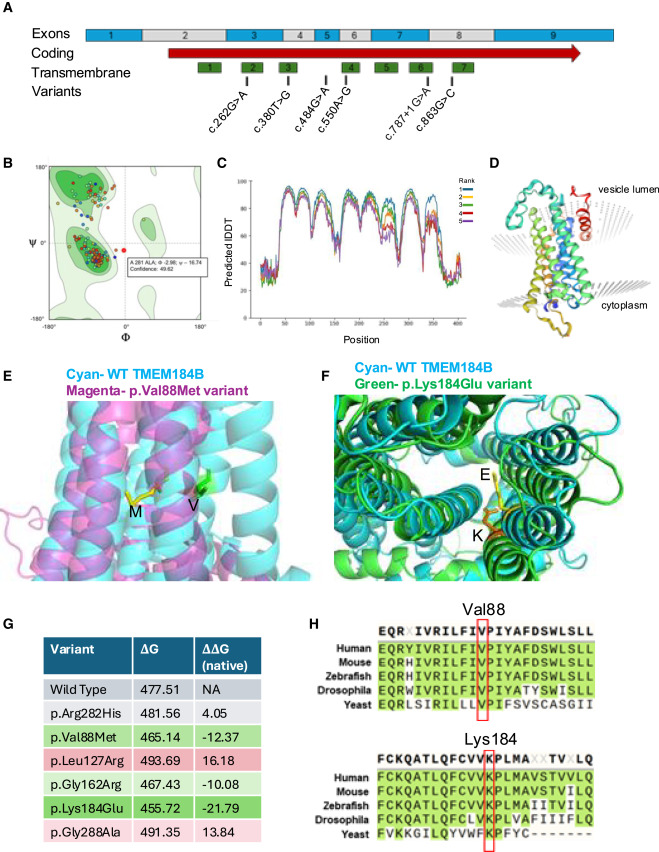
Fig. 2 Structural modeling and free energy of TMEM184B variants indicates significant disruptions to protein stability (A) Structure of the human TMEM184B transcript (GenBank: NM_012264.5). Blue and gray blocks show alternating exons of the spliced mRNA. Red arrow indicates the coding region of isoform a (GenBank: NP_036396.2). Areas predicted to be included in transmembrane helices (green) and locations of human variants (black) are noted. (B) Ramachandran plot showing that the structure predicted by FoldX analysis shows only allowable angles, providing confidence in the structure predicted. (C) Predicted local-distance difference test (pLDDT) scores per position across the whole protein sequence. Higher scores indicate higher confidence structural predictions in that region of the protein. (D) Native protein structure prediction by FoldX. Transmembrane helices are separately colorized. (E) p.Val88Met variant protein (magenta) overlaid onto the native TMEM184B structure (cyan). (F) p.Lys184Glu variant protein (green) overlaid onto the native TMEM184B structure (cyan). (G) Stability analysis calculations using Gibbs free energy. ΔΔG values that are positive indicate decreased protein stability of variant-containing TMEM184B when compared to the predicted native structure, while negative values indicate abnormally heightened protein structural stability. (H) Amino acid context for the p.Val88Met and p.Lys184Glu variants, both of which are conserved from yeast (Saccharomyces cerevisiae Hfl1) to humans. All other variants are conserved from Drosophila (Tmep) to human but are not found in yeast.