
|
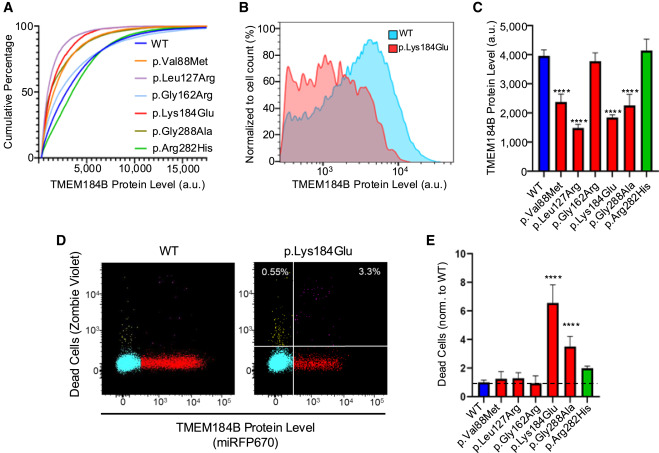
Fig. 6 TMEM184B variants affect protein levels and cell viability (A) Cumulative distribution function of cells expressing WT and TMEM184B variants tagged with miRFP670. (B) Histogram of the fluorescent levels of individual cells expressing p.Lys184Glu tagged with miRFP670 were grouped into 256 bins and normalized to the percentage-mode protein level of each population. (C) Average raw fluorescence of TMEM184B variants compared to WT (3 trials, n = ∼20,000 cells per trial). Error bars represent SD. (D) FACS plots of HEK293T cells overexpressing native TMEM184B (left) or p.Lys184Glu variant (right) and grown in complete media. White numbers on the plots indicate the percentage of dead cells among untransfected (upper left) or TMEM184B-transfected HEK293T cells (upper right). (E) Percentage of dead TMEM184B variant-expressing cells normalized to WT levels (dashed line). 3 trials, n = ∼20,000 cells per trial. Error bars represent SD. ∗∗∗∗p < 0.0001.