
Fig. 5
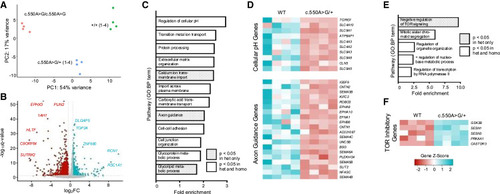
Transcriptomic analysis of variant-containing human iPSCs reveals alterations in neurodevelopmental pathways and endolysosomal function (A) Principal-component analysis (PCA) plot of RNA-seq data generated using DESeq2. Data were derived from induced pluripotent stem cell (iPSC) lines representing three groups (n = 4 biological replicates per group): wild type (WT), TMEM184Bc.550A>G/+, and TMEM184Bc.550A>G/c.550A>G. (B) Volcano plot illustrating the differential expression analysis results for TMEM184Bc.550A>G/+. Genes meeting the significance threshold (p < 0.05) and fold-change criteria (log2FC > 0.585 for upregulated genes [= FC > 1.5], log2FC < −0.415 for downregulated genes [= FC < 0.75]) are highlighted in teal (upregulated) and red (downregulated), respectively. (C) Downregulated GO biological processes (slim) (>1.5× enriched) in TMEM184Bc.550A>G/+. (D) Genes in two processes of likely relevance (regulation of cell pH and axon guidance) are plotted in respective Z-score normalized heatmaps. (E) Upregulated GO biological processes (slim) (>1.5× enriched) in TMEM184Bc.550A>G/+. (F) Heatmap of genes within one process of likely relevance (negative regulation of TOR signaling), scaled identically to (D). het, heterozygous; homo, homozygous; (+), WT allele. |