
|
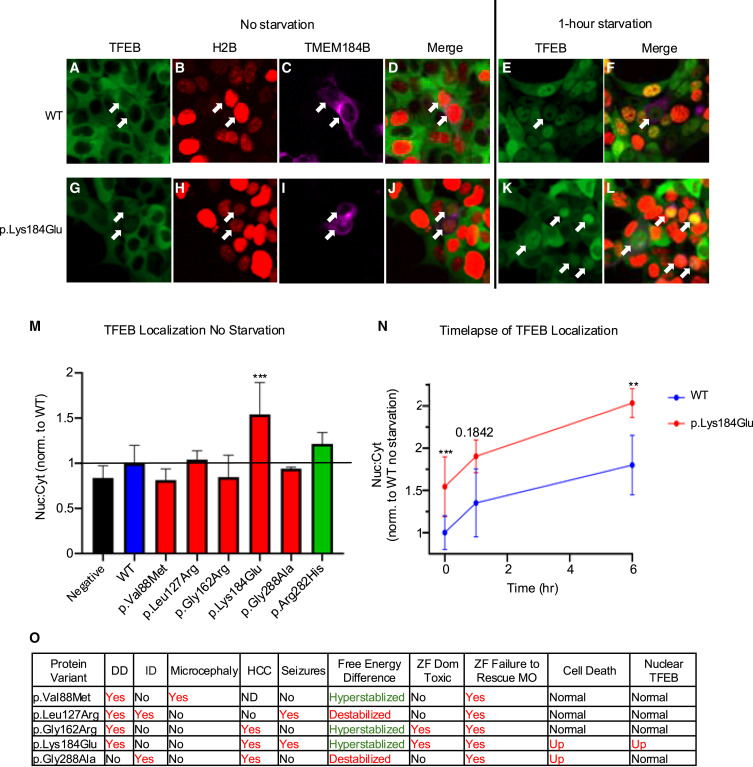
Fig. 7 TFEB nuclear-to-cytoplasmic ratio is dominantly altered by expression of TMEM184B variants identified in affected individuals (A–D) Multichannel images of unstarved HEK293T cells overexpressing WT TMEM184B. Shown are (A) TFEB-GFP (green), (B) H2B-mRuby (red), and (C) TMEM184B-miRFP670 (magenta). (D) is a merged image. (E and F) HEK293T cells expressing WT TMEM184B and starved for 1 h. Shown are (E) TFEB-GFP and (F) merge (includes H2B:mRuby and MEM184B-miRFP670). Arrows in all images point to TMEM184B-miRFP670 transfected cells. All H2B-mRuby images had their lookup tables adjusted to 4,000 for visual clarity. (G–J) Multichannel images of unstarved HEK293T cells overexpressing TMEM184B p.Lys184Glu variant. Panels match those of the WT in (A)–(D). (K and L) TMEM184B-miRFP670 transfected cells starved for 1 h. TFEB-GFP and a merged image (TFEB-GFP, H2B:mRuby, and TMEM184B-miRFP670) are shown. (M) Ratio of mean TFEB-GFP fluorescence in the nucleus vs. cytoplasm in TMEM184B-miRFP670 expressing cells, normalized to WT cells. (N) Time course of TFEB nuclear/cytoplasmic localization of WT- and p.Lys184Glu-expressing cells over 6 h of starvation (N = 3 trials). Error bars in (M) and (N) represent SD. ∗∗∗p < 0.001, ∗∗p < 0.01. Fifty cells were quantified per trial, variant, and time point except for p.Lys184Glu at 6-h starvation (42–50 cells). (O) Summary table displaying the clinical, free energy, zebrafish, and cell assay results of each case-associated variant. Red text denotes differences from the WT condition. In the “free energy difference” column, red text indicates destabilization, and green text indicates hyperstabilization.