
- Title
-
Genetic ablation of Pth4 disrupts calcium-phosphate balance, bone development, and kidney transcriptome in teleosts
- Authors
- Méndez-Martínez, L., Suarez-Bregua, P., Guerrero-Peña, L., Barreiro-Docío, E., Costas-Prado, C., Cobelo-García, A., Rotllant, J.
- Source
- Full text @ Gen. Comp. Endocrinol.
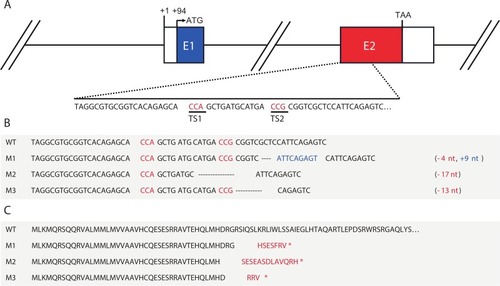
CRISPR/Cas9-induced mutations at the zebrafish pth4 locus. (A) Graphical representation of the pth4 gene. Coding exons are represented with colored boxes and the 5′-UTR and 3′UTR are represented as white boxes. (B) Nucleotide sequence of wild-type pth4 (WT) and induced mutations (M1, M2 and M3). The protospacer-adjacent motif (PAM) is indicated in red, denoting the mutation target sites (TS1 and TS2). Hyphens represent deletions and nucleotides in blue represent insertions. (C) Predicted amino acid sequences of wild-type pth4 and induced mutations. Amino acids in red differ from the WT sequence and asterisks indicate stop codons. (For interpretation of the references to color in this figure legend, the reader is referred to the web version of this article.) |
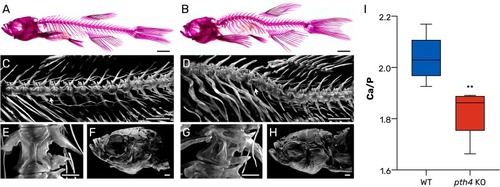
Mutant pth4KO zebrafish exhibit early-onset physical decline, spinal deformities and altered Ca/P ratio in scales. (A-B) Lateral whole-body images of alizarin red stained WT (A) and pth4KO(B) adult zebrafish (360 dpf). The mutant fish display prominent deformities including lordosis, kyphosis and malformed vertebrae. (C-D) Light-sheet fluorescence microscopy (LSFM) images of the axial skeleton of WT (C) and pth4KO (D) zebrafish showing vertebrae from c8-c6 to c19. White arrows indicate the specific vertebrae highlighted in panels E and F. (E-F) LSFM images of vertebra c11 in WT (E) and pth4KO (F) zebrafish. WT zebrafish exhibit well-developed vertebral structures, with the characteristic hourglass shape of the centrum clearly visible, while the mutant exhibits significant malformations. (G-H) LSFM images of craniofacial skeleton of WT (G) and pth4KO (H) zebrafish, in which no major abnormalities were detected. Scale bar: (A-B) 2 mm, (C-D) 1 mm, (E-F) 200 µm (G-H) 500 µm. (I) Boxplot representing the Ca/P ratio as determined in scales. The median value is represented by a dark horizontal line, and the whiskers represent the minimum and maximum values of the data set, ** P < 0.01. (For interpretation of the references to color in this figure legend, the reader is referred to the web version of this article.) PHENOTYPE:
|
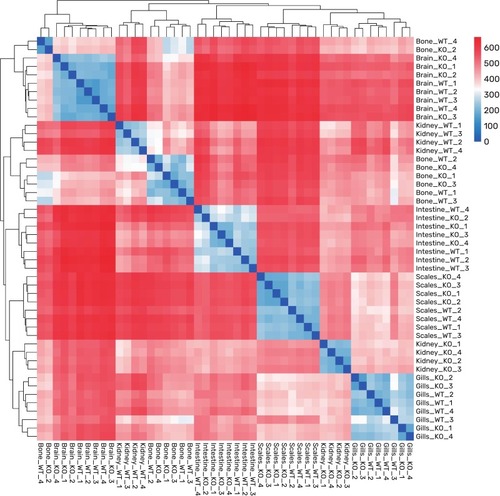
Global Overview of RNA-sequencing Data. Sample-to-sample distance heatmap. Clear within-tissue clustering is evident, with kidney samples displaying the most significant transcriptional divergence. |
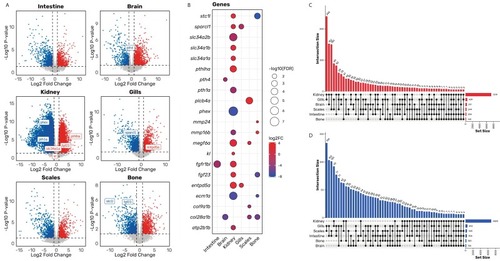
Knockout of pth4 gene induces transcriptomic changes in mineral homeostasis-related genes in multiple tissues. (A) Volcano plots illustrating differentially expressed genes (DEGs) between WT and pth4KO zebrafish for each tissue under study. Colored dots represent significant DEGs (p < 0.05), with red indicating upregulated genes and blue indicating downregulated genes. Horizontal and vertical dashed lines illustrate the significance thresholds (P < 0.05 and |-Log2FC|>1, respectively). Significant genes related to mineral homeostasis are highlighted. (B) A Bubble plot is presented, showing selected relevant DEGs involved in mineral homeostasis across the studied tissues. The size of the bubbles indicates the statistical significance of the DEGs (−log10(FDR)), while the color indicates the log2 fold change (log2FC), ranging from blue (downregulated) to red (upregulated). (C-D) Upset plots showing intersections of upregulated (C) and downregulated (D) DEGs (≥5) derived from all the tissues that were studied. The total number of DEGs from each tissue is represented on the horizontal right side bar plot. (For interpretation of the references to color in this figure legend, the reader is referred to the web version of this article.) |