
IMAGE
Fig. 3
- ID
- ZDB-IMAGE-251023-3
- Publication
- Méndez-Martínez et al., 2025 - Genetic ablation of Pth4 disrupts calcium-phosphate balance, bone development, and kidney transcriptome in teleosts
- All Figures
- Figures for Méndez-Martínez et al., 2025
Image
|
Figure Caption
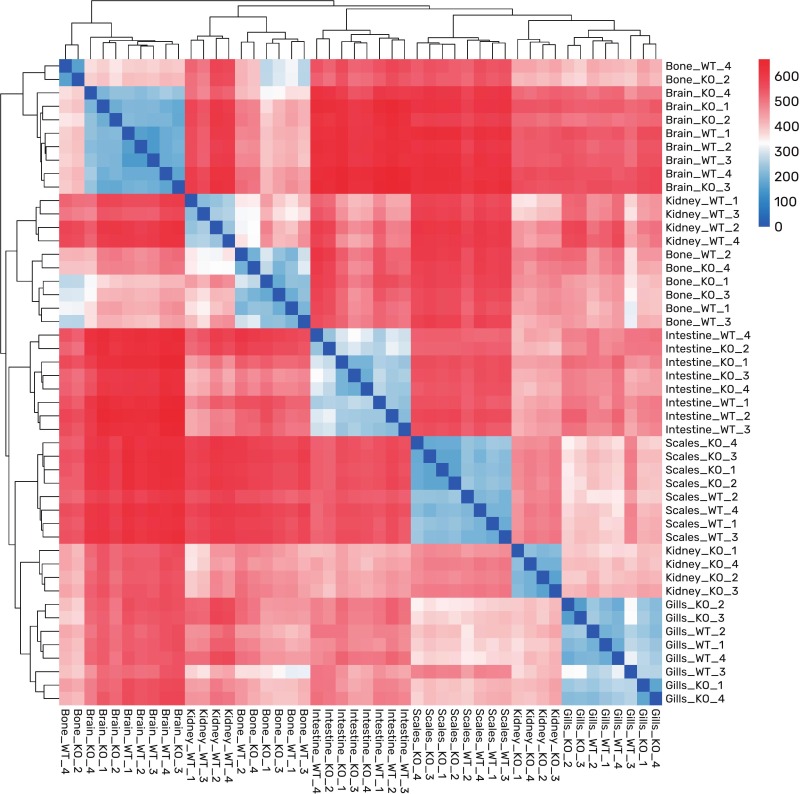
Fig. 3 Global Overview of RNA-sequencing Data. Sample-to-sample distance heatmap. Clear within-tissue clustering is evident, with kidney samples displaying the most significant transcriptional divergence.
Acknowledgments
This image is the copyrighted work of the attributed author or publisher, and
ZFIN has permission only to display this image to its users.
Additional permissions should be obtained from the applicable author or publisher of the image.
Full text @ Gen. Comp. Endocrinol.