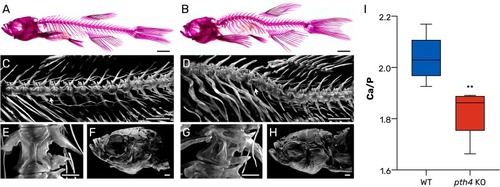
Mutant pth4KO zebrafish exhibit early-onset physical decline, spinal deformities and altered Ca/P ratio in scales. (A-B) Lateral whole-body images of alizarin red stained WT (A) and pth4KO(B) adult zebrafish (360 dpf). The mutant fish display prominent deformities including lordosis, kyphosis and malformed vertebrae. (C-D) Light-sheet fluorescence microscopy (LSFM) images of the axial skeleton of WT (C) and pth4KO (D) zebrafish showing vertebrae from c8-c6 to c19. White arrows indicate the specific vertebrae highlighted in panels E and F. (E-F) LSFM images of vertebra c11 in WT (E) and pth4KO (F) zebrafish. WT zebrafish exhibit well-developed vertebral structures, with the characteristic hourglass shape of the centrum clearly visible, while the mutant exhibits significant malformations. (G-H) LSFM images of craniofacial skeleton of WT (G) and pth4KO (H) zebrafish, in which no major abnormalities were detected. Scale bar: (A-B) 2 mm, (C-D) 1 mm, (E-F) 200 µm (G-H) 500 µm. (I) Boxplot representing the Ca/P ratio as determined in scales. The median value is represented by a dark horizontal line, and the whiskers represent the minimum and maximum values of the data set, ** P < 0.01. (For interpretation of the references to color in this figure legend, the reader is referred to the web version of this article.)
|
