
Fig. 4
- ID
- ZDB-FIG-251023-4
- Publication
- Méndez-Martínez et al., 2025 - Genetic ablation of Pth4 disrupts calcium-phosphate balance, bone development, and kidney transcriptome in teleosts
- Other Figures
- All Figure Page
- Back to All Figure Page
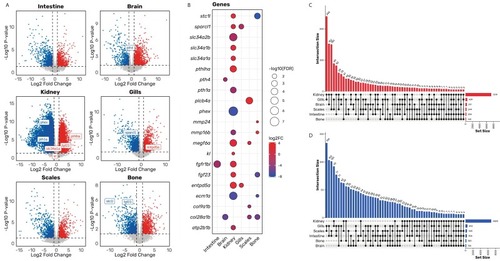
Knockout of pth4 gene induces transcriptomic changes in mineral homeostasis-related genes in multiple tissues. (A) Volcano plots illustrating differentially expressed genes (DEGs) between WT and pth4KO zebrafish for each tissue under study. Colored dots represent significant DEGs (p < 0.05), with red indicating upregulated genes and blue indicating downregulated genes. Horizontal and vertical dashed lines illustrate the significance thresholds (P < 0.05 and |-Log2FC|>1, respectively). Significant genes related to mineral homeostasis are highlighted. (B) A Bubble plot is presented, showing selected relevant DEGs involved in mineral homeostasis across the studied tissues. The size of the bubbles indicates the statistical significance of the DEGs (−log10(FDR)), while the color indicates the log2 fold change (log2FC), ranging from blue (downregulated) to red (upregulated). (C-D) Upset plots showing intersections of upregulated (C) and downregulated (D) DEGs (≥5) derived from all the tissues that were studied. The total number of DEGs from each tissue is represented on the horizontal right side bar plot. (For interpretation of the references to color in this figure legend, the reader is referred to the web version of this article.) |